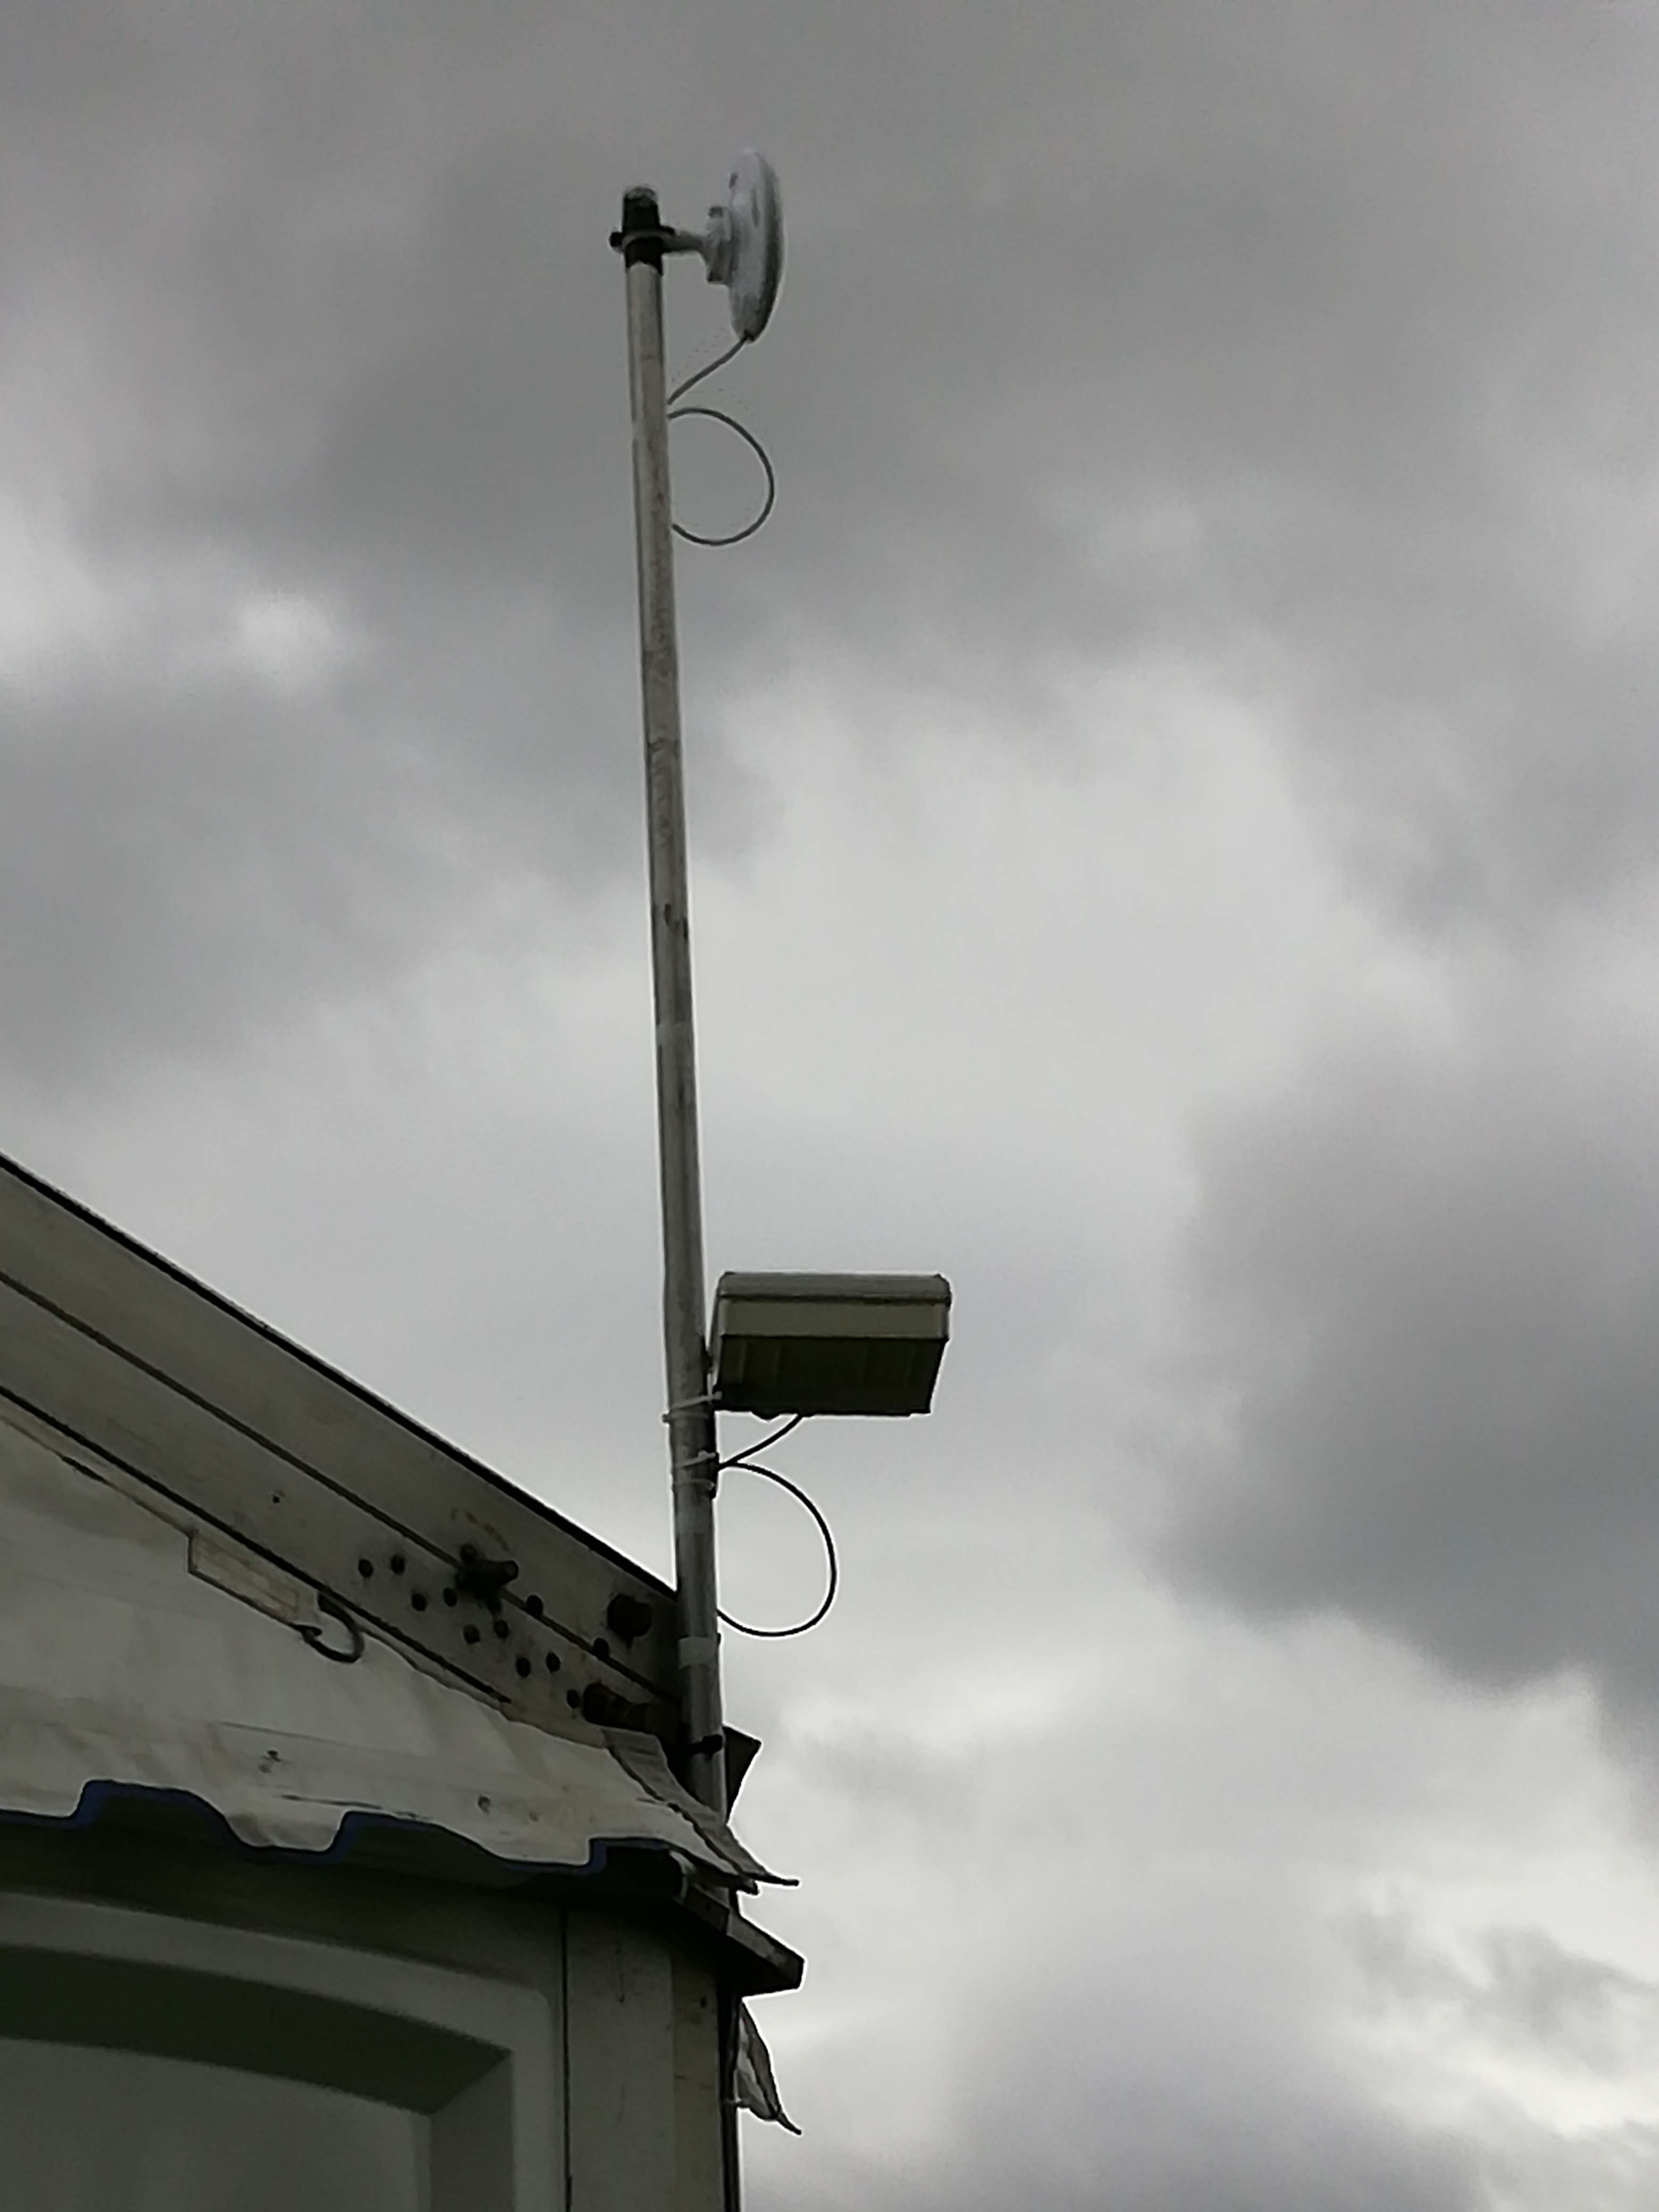
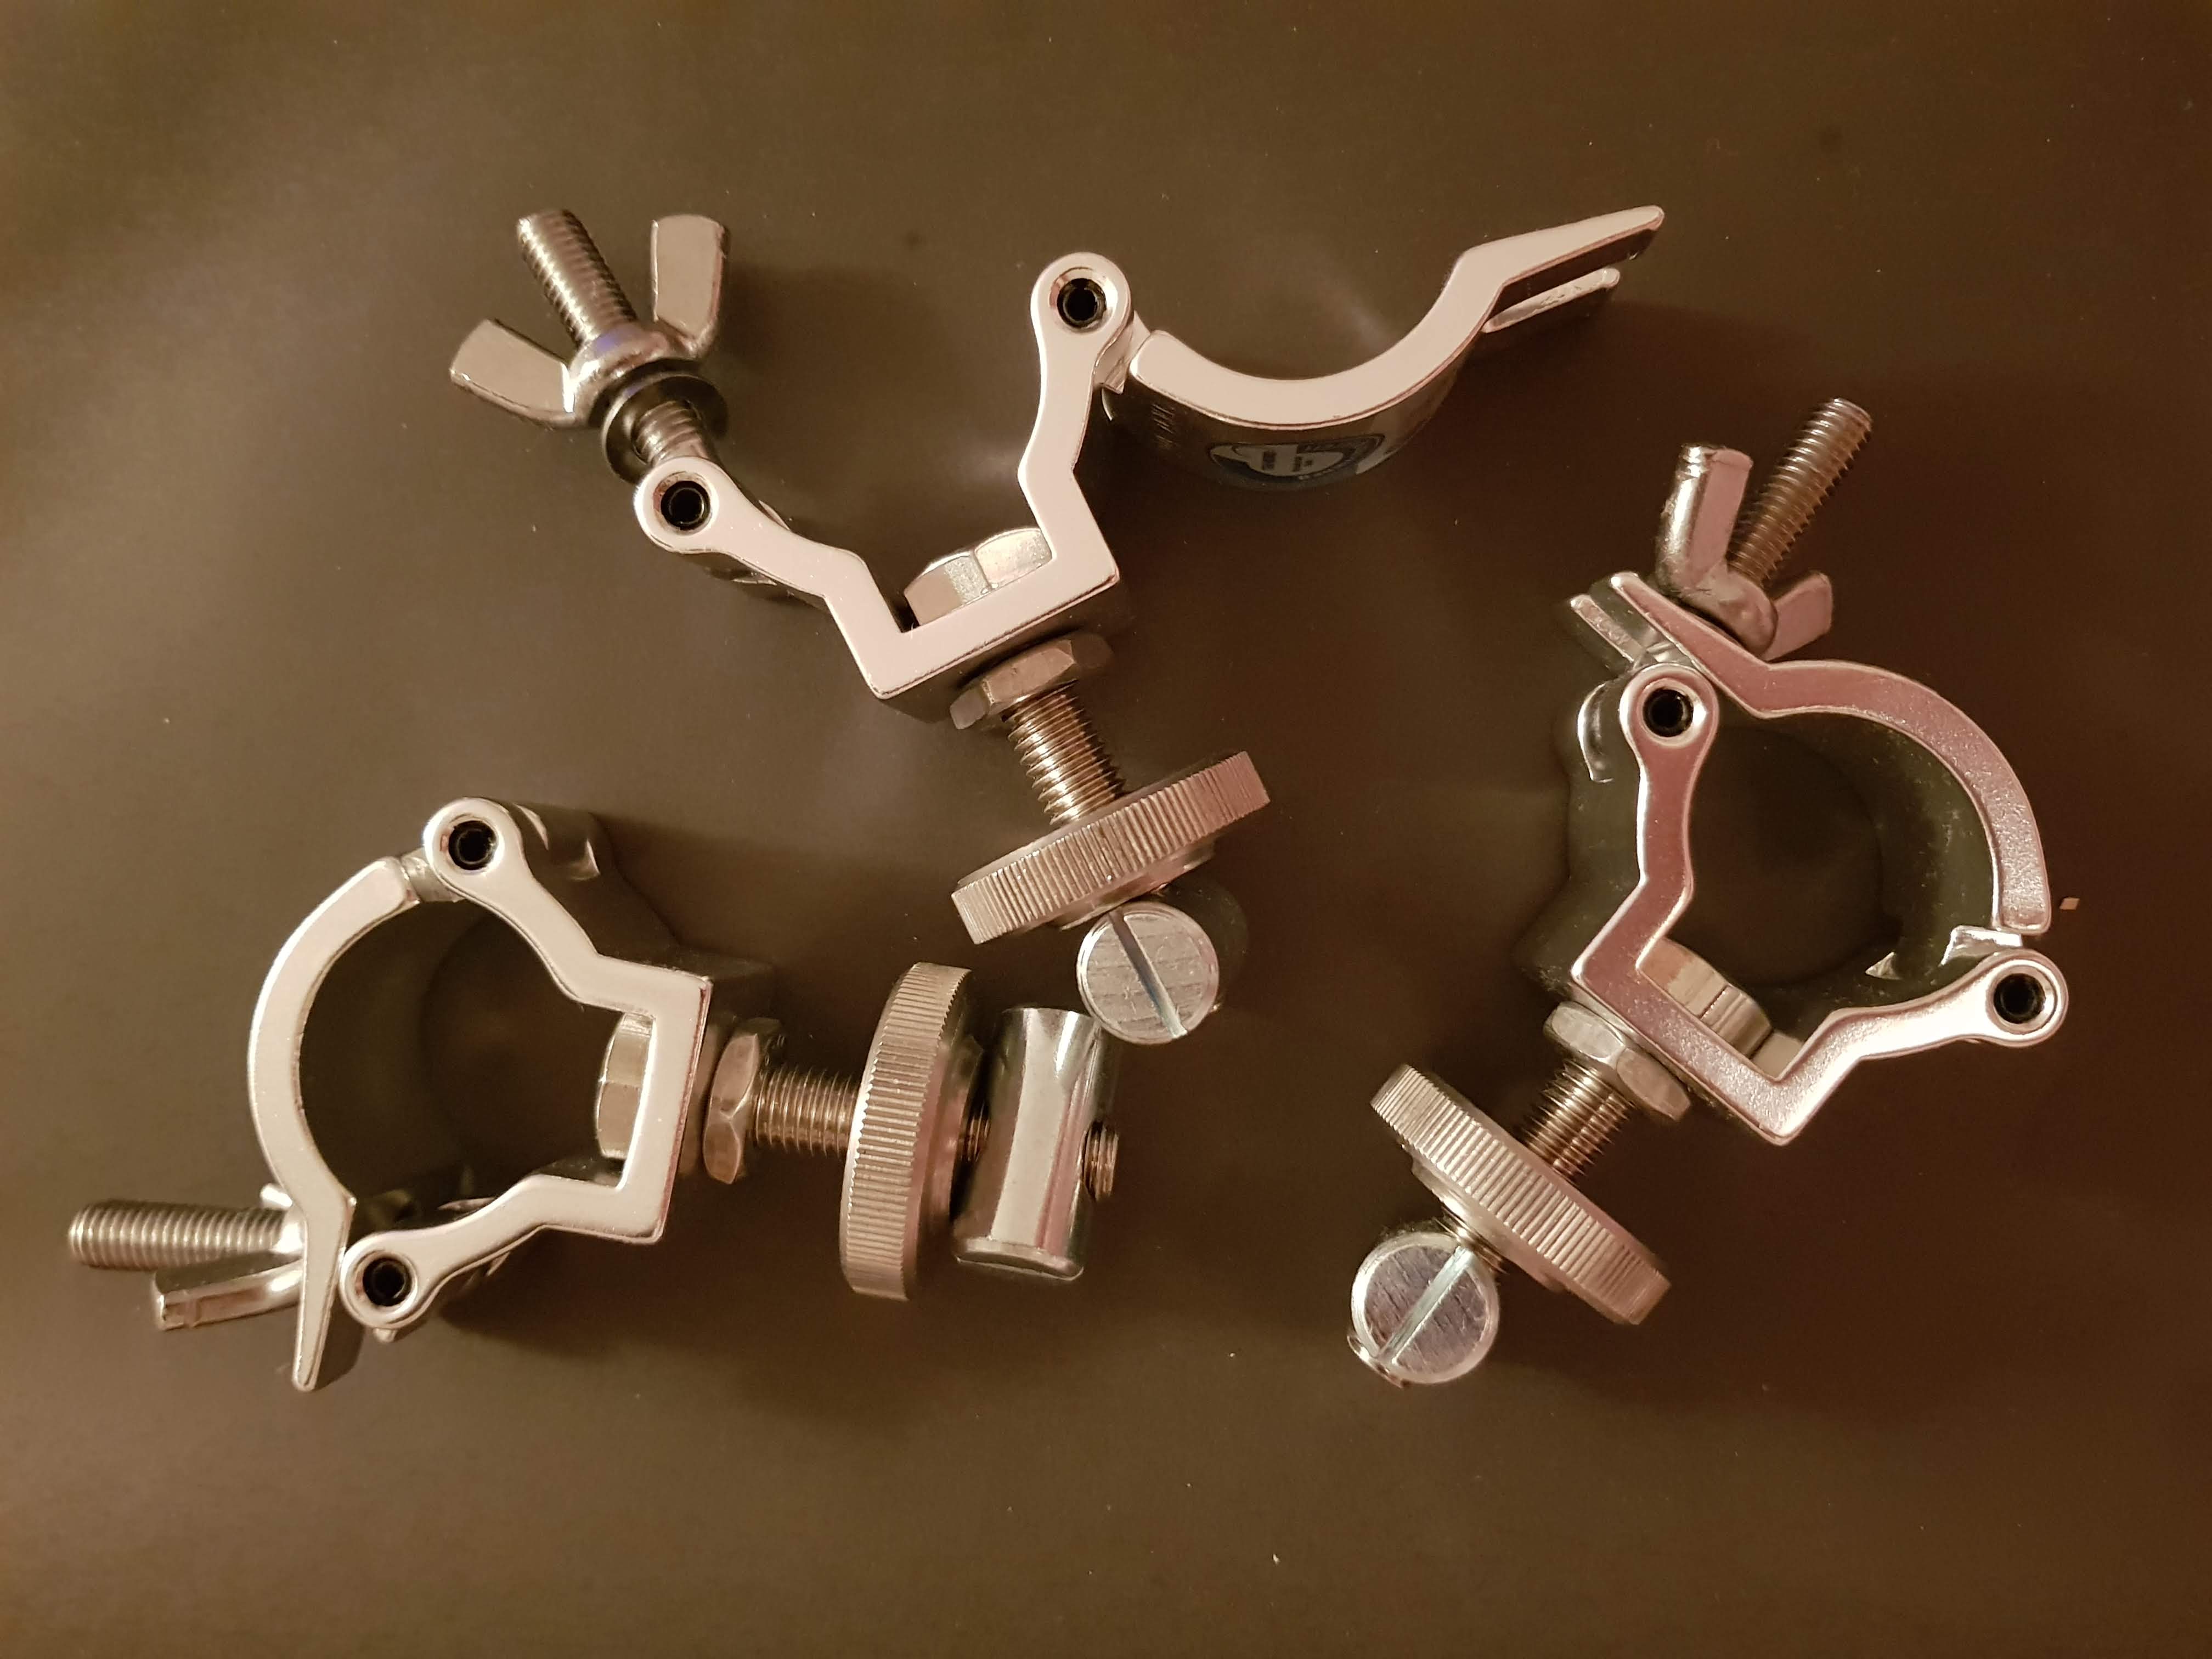
Wireless access points and point-to-point links have been installed on the aluminum extrusion structural elements of outdoor event marquees using a innovative system that employs a keeder rail. The keeder rail accommodates a cylindrical metal piece with a threaded hole drilled perpendicular to its length, which can be easily secured in place by turning a large, flat disk with a threaded hole in the center. This setup supports a pipe clamp that is designed to fit standard aluminum poles, with two clamps used per pole to securely anchor the pole vertically on the side of the tent. This innovative method of installation allows for reliable and secure connectivity during events, while also maintaining the aesthetic integrity of the marquees.
12 posts tagged with "hola"
View All TagsWireless Coverage at Manchester Pride - A Heatmap Analysis
As part of this deployment project, our team encountered a physically demanding challenge: the installation of two sectors on the 18th floor of a tower block adjacent to the event site. From this vantage point, we were able to transmit a strong signal to multiple wireless point-to-point stations attached to temporary structures and buildings within the site. Additionally, we provided indoor wireless coverage in an underground parking garage that served as one of the event venues. To ensure optimal coverage, we created a heat map of the wireless signal strength in this area. Moreover, we established uplinks at various locations throughout the site to support ticket booths, CCTV cameras, payment terminals for bars, a production office, and emergency liaison cabins. Overall, this comprehensive approach to wireless connectivity allowed for seamless communication and connectivity throughout the event.
Provisioning Cisco Cloud Wireless Controller
In this project, we aimed to successfully install and configure the Cisco Catalyst c9800-CL wireless controller using KVM (Kernel-based Virtual Machine). The c9800-CL is a powerful and flexible cloud-based wireless controller that is capable of managing both on-premises and cloud-based wireless networks. It belongs to the Cisco Catalyst 9800 series and offers a range of advanced features such as wireless intrusion prevention, location services, and guest access.
To begin, we installed virtualization software and enabled the libvirtd service on our system. This allowed us to create and manage virtual machines using KVM. We then created a network bridge using the brctl command, which enabled communication between the virtual machine and the host system.
With the necessary infrastructure in place, we used the virt-install command to install the c9800-CL on a new virtual machine. During the installation process, we specified a number of options such as the connection to the virtualization server, the operating system variant, the architecture of the virtual machine, and the CPU type.
Once the virtual machine was set up and the c9800-CL was installed, we provided a script to configure the controller. This script contained a series of steps that were necessary to properly set up the c9800-CL. These steps included setting the hostname, creating a user account, configuring the Gigabit Ethernet interfaces, creating a VLAN, setting up static routes, shutting down and re-enabling the radio frequencies, and setting the country code. We also configured the virtual wireless LAN controller (VWLC) and set the DNS and NTP servers to ensure proper network connectivity and synchronization.
Finally, we demonstrated how to access the GUI of the c9800-CL at the specified IP address and walk through the zero-day configuration steps to set up a wireless network. By following these steps, users can easily configure the c9800-CL to meet the specific needs of their wireless network.
Truss Connection Node Modeling
In this project, we designed and fabricated a dodecahedron-shaped structural node for use in a truss system. A truss is a structural element that consists of a series of interconnected struts, which work together to distribute loads evenly and maintain the stability and strength of the structure. The node we created had 12 pentagonal faces, and each truss strut was attached to the center of one of these faces via a single bolt. This bolt passed through a hole in the center of the end cap of the strut and was secured in place by screwing it into a threaded hole in the center of the dodecahedron face.
The node was made of steel and was designed to resist the forces transmitted through the truss. Its dodecahedron shape and the use of a single bolt per strut allowed for a high level of flexibility and adaptability, as the struts could be easily rearranged or removed due to their modular design. This feature made the node a crucial element in the overall design of the truss, as it enabled the structure to be easily modified or altered to meet changing needs or requirements.
Overall, the dodecahedron-shaped structural node we created proved to be an effective and efficient solution for joining multiple truss struts together at a single point. It played a vital role in distributing loads evenly and maintaining the stability and strength of the truss, and its modular design allowed for flexibility and adaptability in the overall structure.
Creating 3d Buildings From Mastermap With Qgis
The Ordnance Survey Mastermap Topography Layer, the Building Height Attribute (BHA), and the Environment Agency LiDAR Digital Terrain Model (DTM) are all useful data sources that can be used to create 3D models of buildings. By combining this data and using the Qgis2ThreeJS plugin in QGIS, it is possible to visualize the BHA data in 3D and create a 3D model of a building.
To do this, the Qgis2ThreeJS plugin must be installed and the BHA data, DTM data, and any additional desired layers must be loaded into the QGIS project. The plugin can then be used to style the BHA data and specify the desired height attribute for extrusion, resulting in a 3D model of the building. This model can be saved as an HTML file and viewed in a web browser.
When combined with the LiDAR DTM, the resulting 3D model is fairly accurate and can be opened in Grasshopper, a visual programming language and environment that runs within the Rhinoceros 3D CAD application. With the addition of the Ladybug plugin, this 3D model can be used to perform detailed analyses of climate data and create customized, interactive visualizations for environmentally-informed design, such as sunlight studies.
References
Gifford Circus Cyr Wheel Performances - A Custom Modular Circular Stage
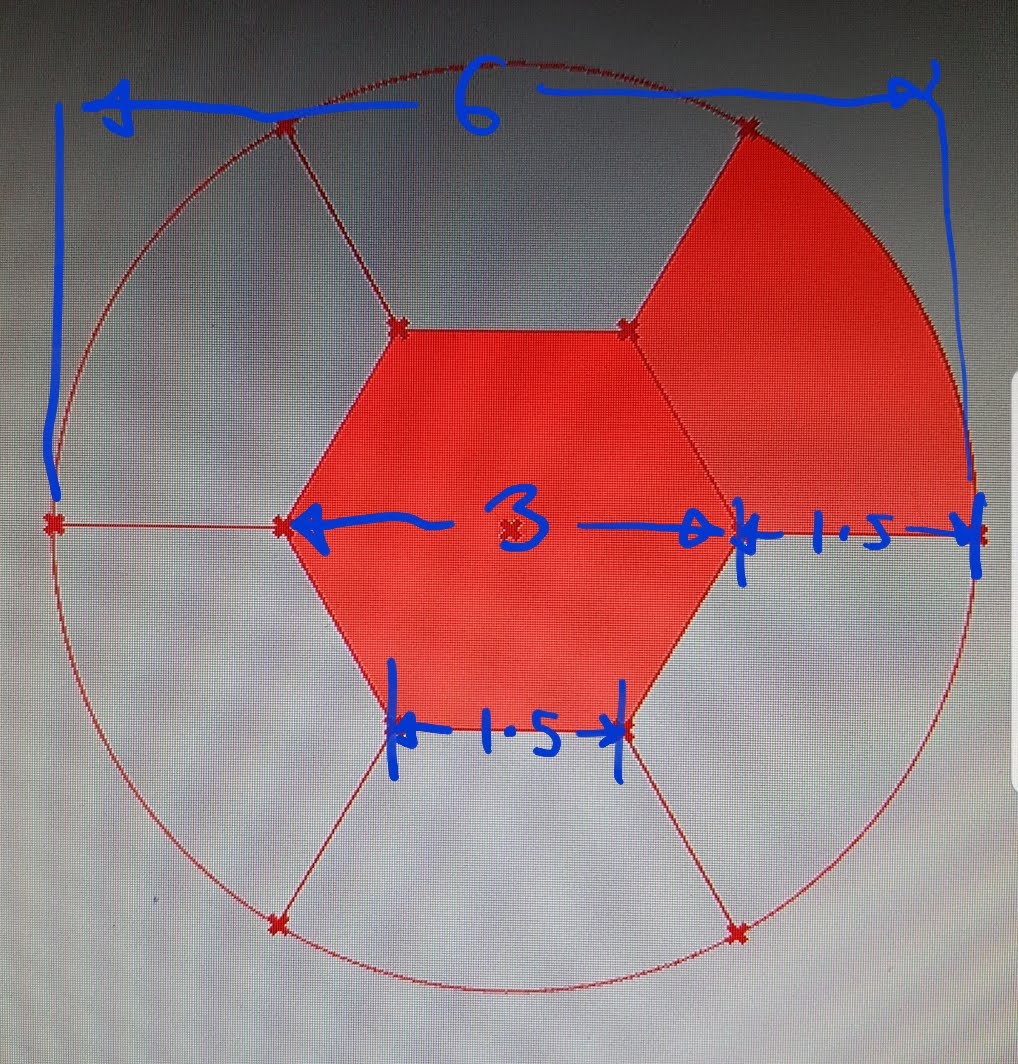
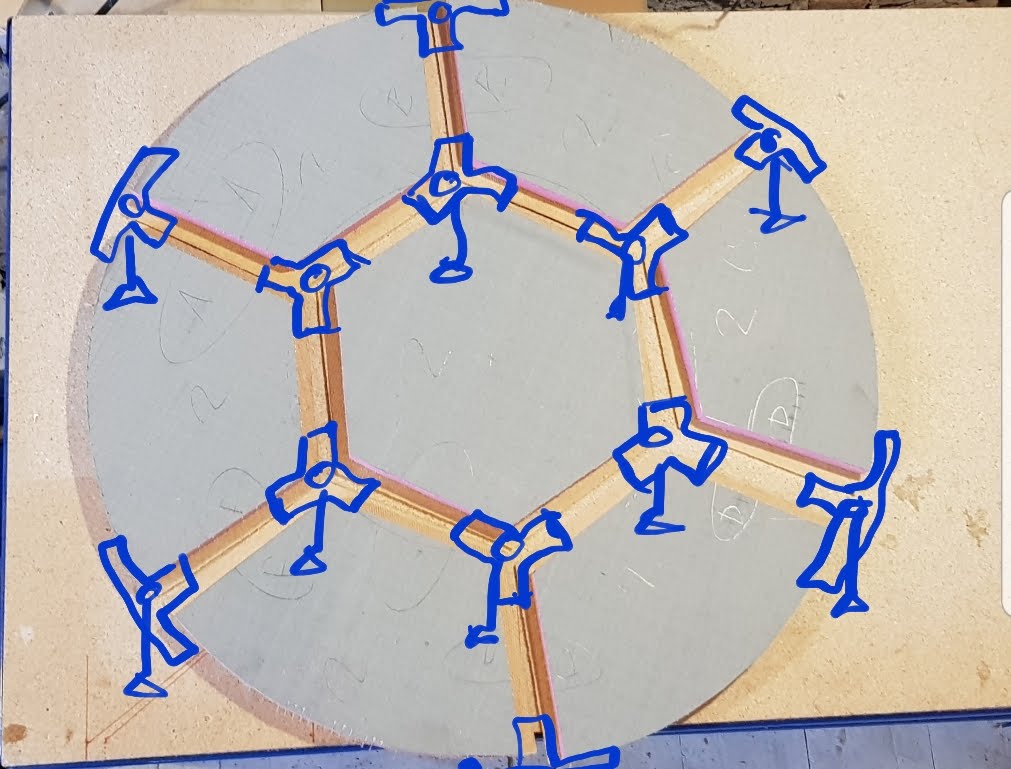
We were commissioned to design and construct a circular stage for a Cyr wheel performance in Gifford's Circus. The stage had to meet several requirements: it had to have a diameter of 6 meters, be able to be disassembled into pieces small enough to fit through a door with a width of 2.6 meters, be able to support the weight of performers, be easy to assemble by two people in a short amount of time (with each panel weighing no more than 50kg), be flat and level on rough ground, and be durable enough to withstand the rough handling and moisture of circus life.
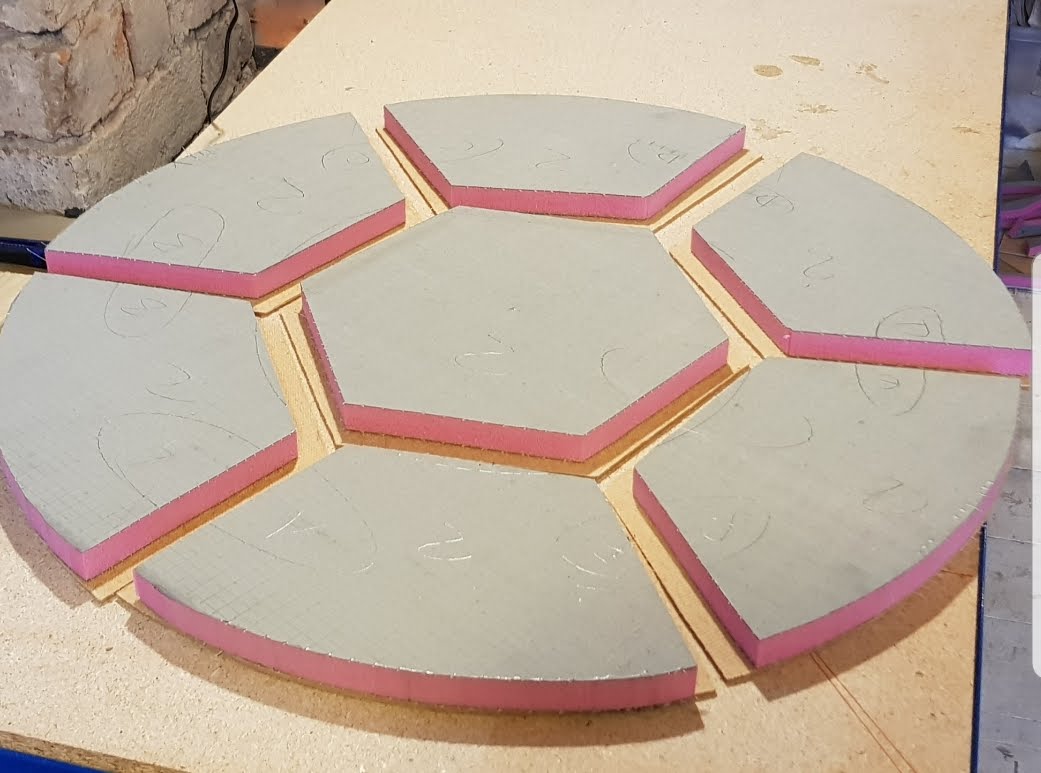
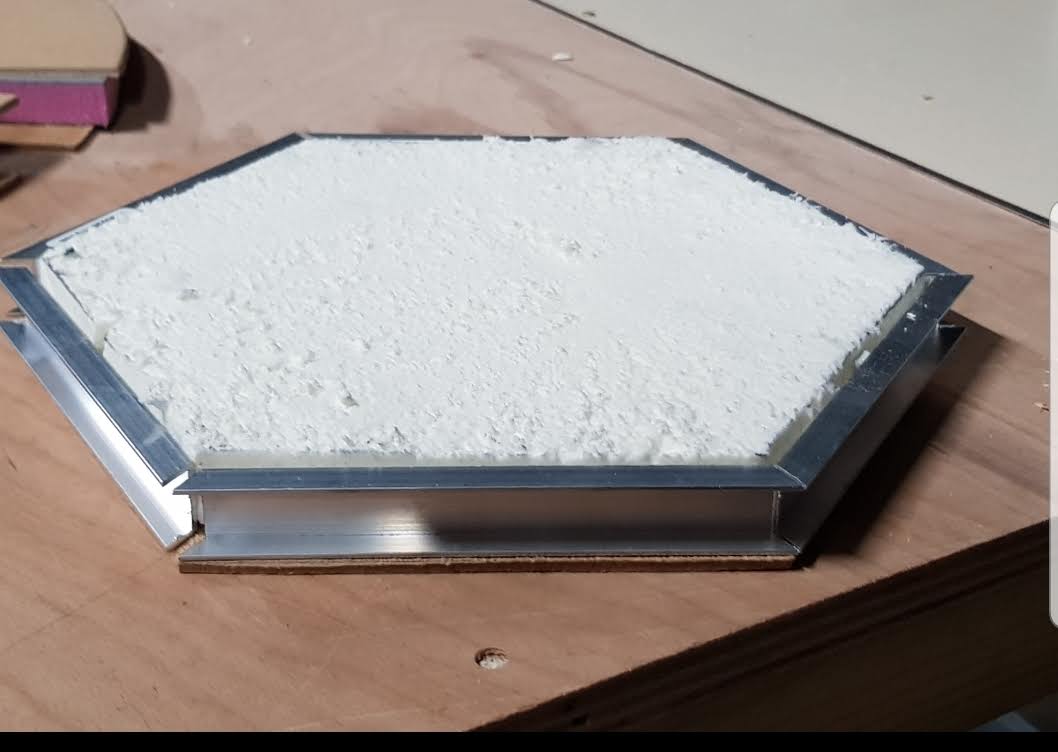
To achieve these goals, we considered various designs for the circle and ultimately settled on a composite panel made of an XPS core sandwiched between two layers of extra durable fibreglass, with a non-slip coating. The material was cut into the necessary shapes using a hot wire cutter with a rectangular profile, and the foam was removed from the mating edges, leaving only the outer fibreglass material. Adhesive was applied and aluminum extrusion was pressed into the edges of the panels. The aluminum provided protection for the edges, supported the edges to prevent deflection, and provided slots for the removable leg structures that connected the panels together.
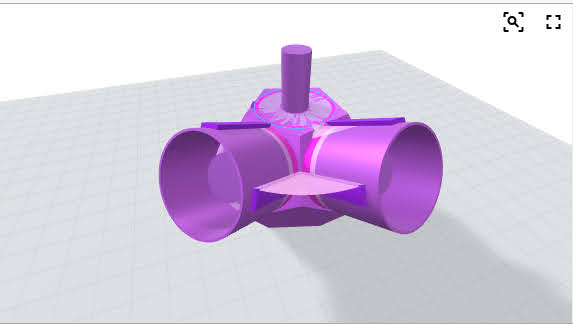
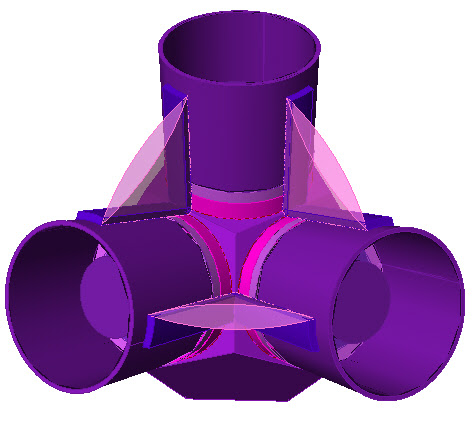
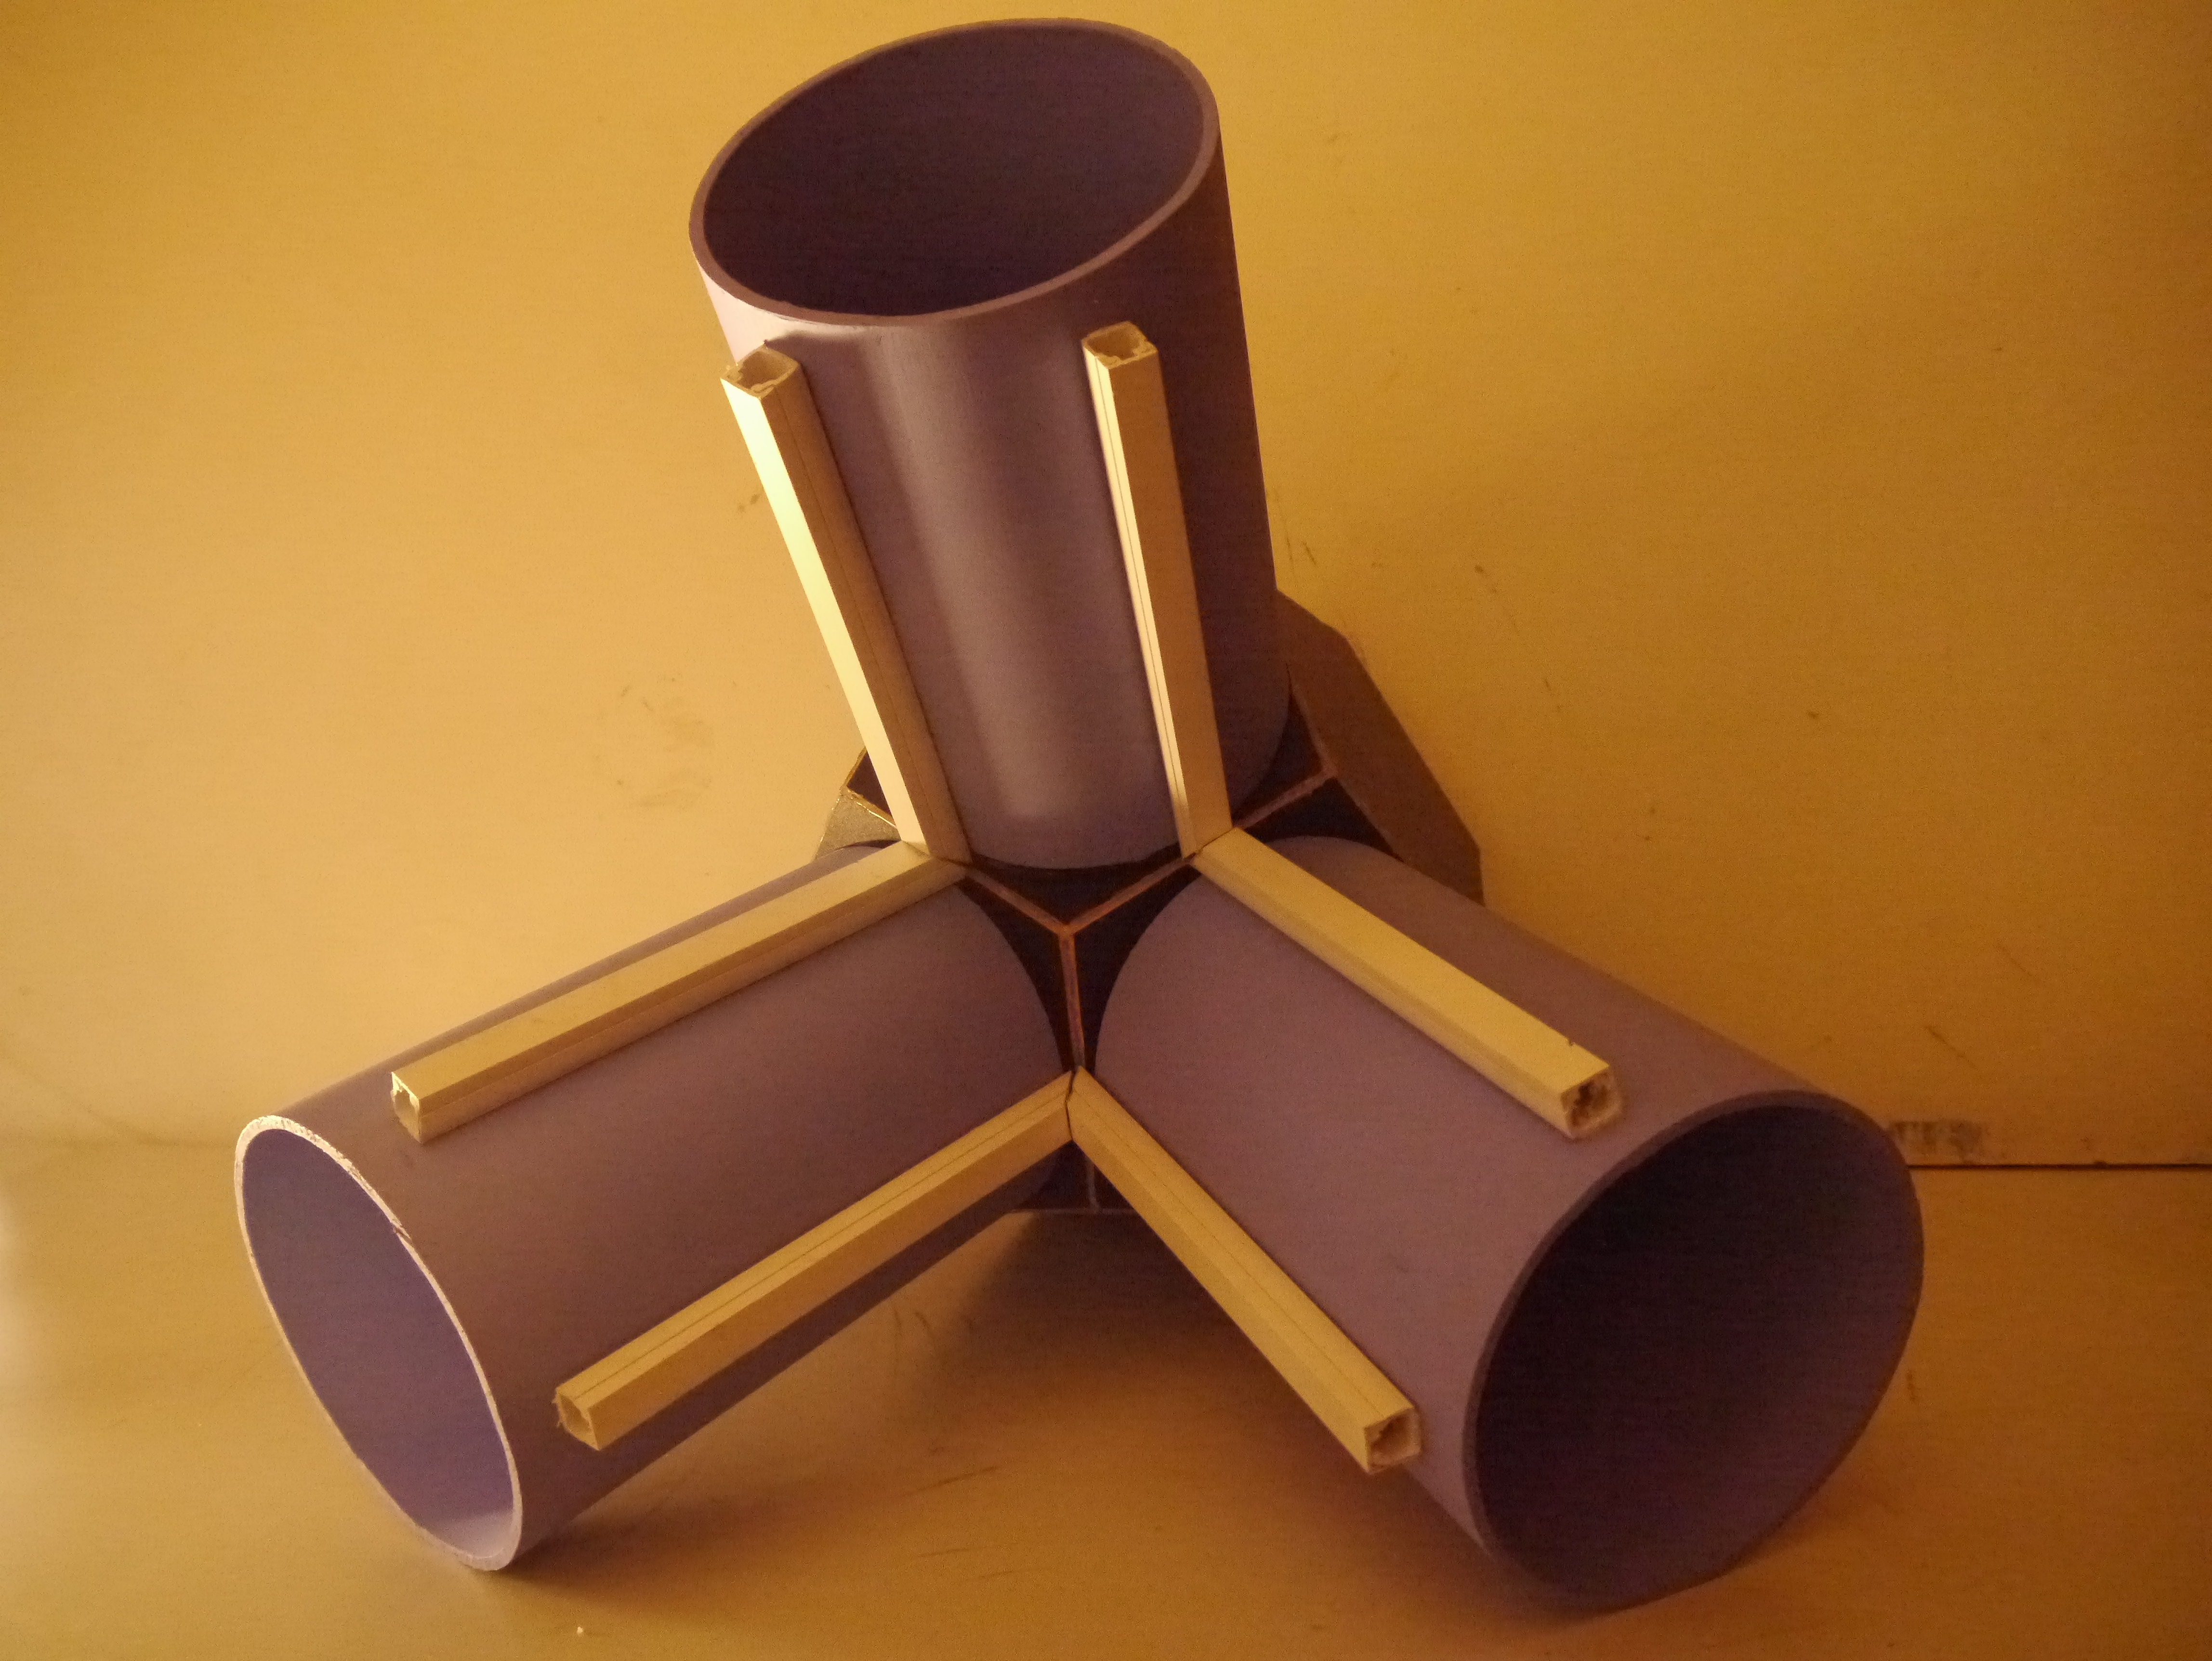
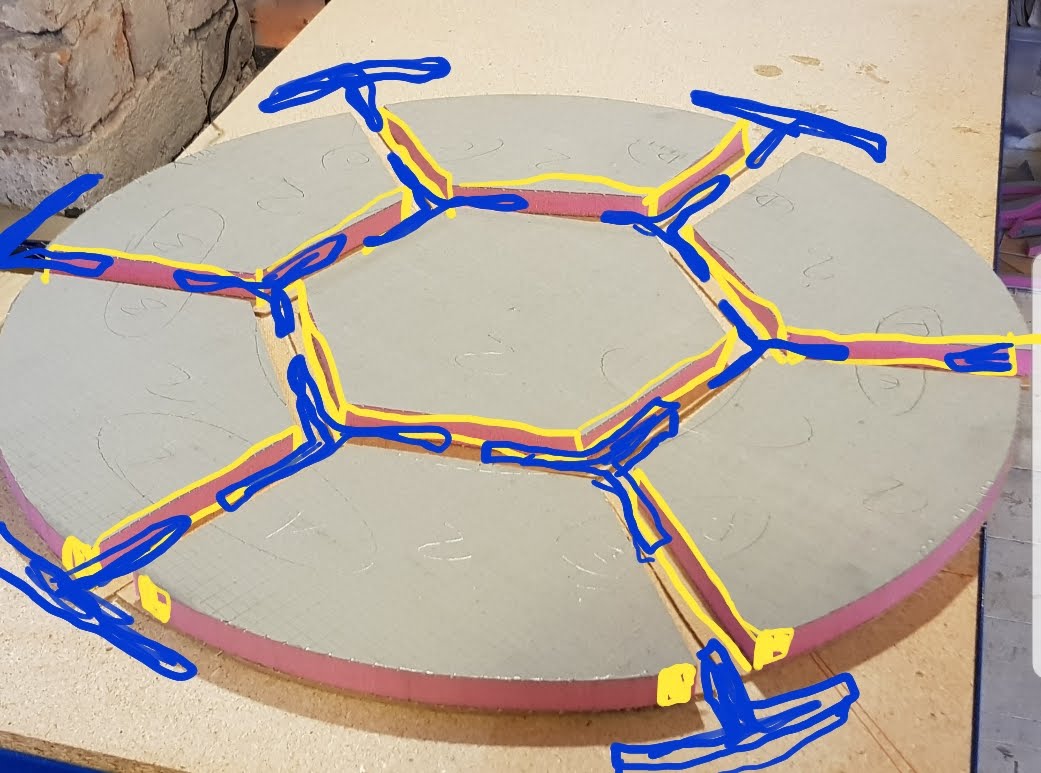
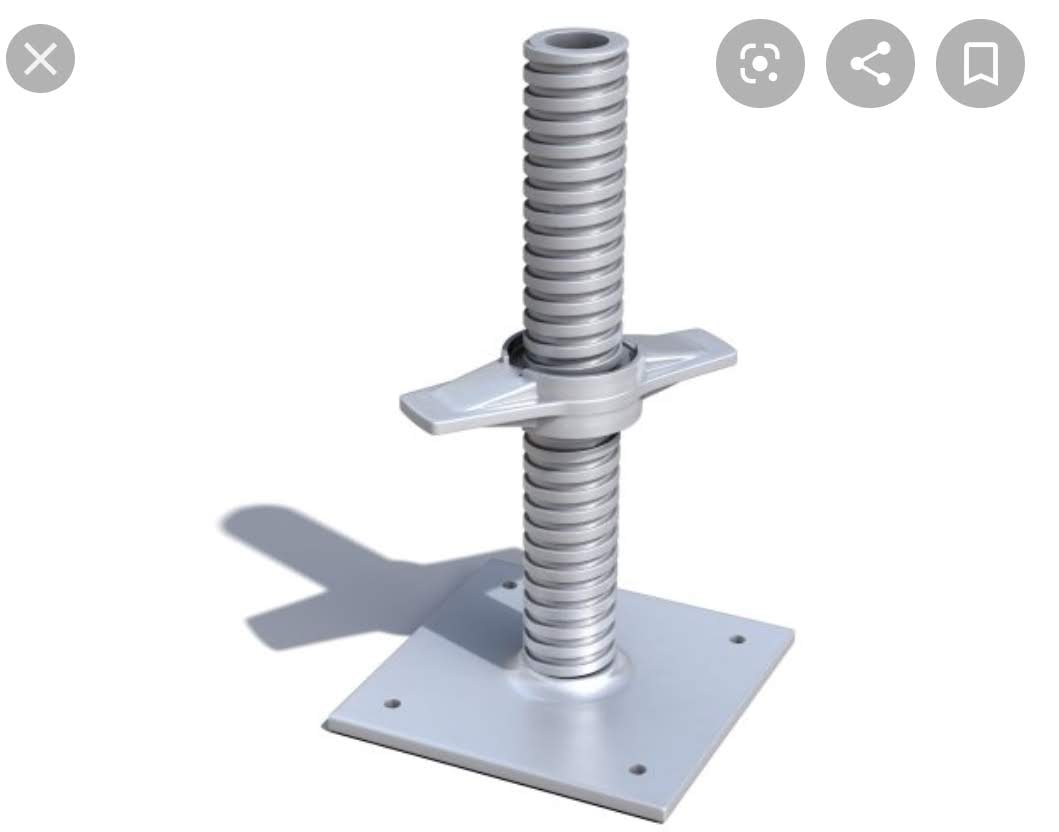
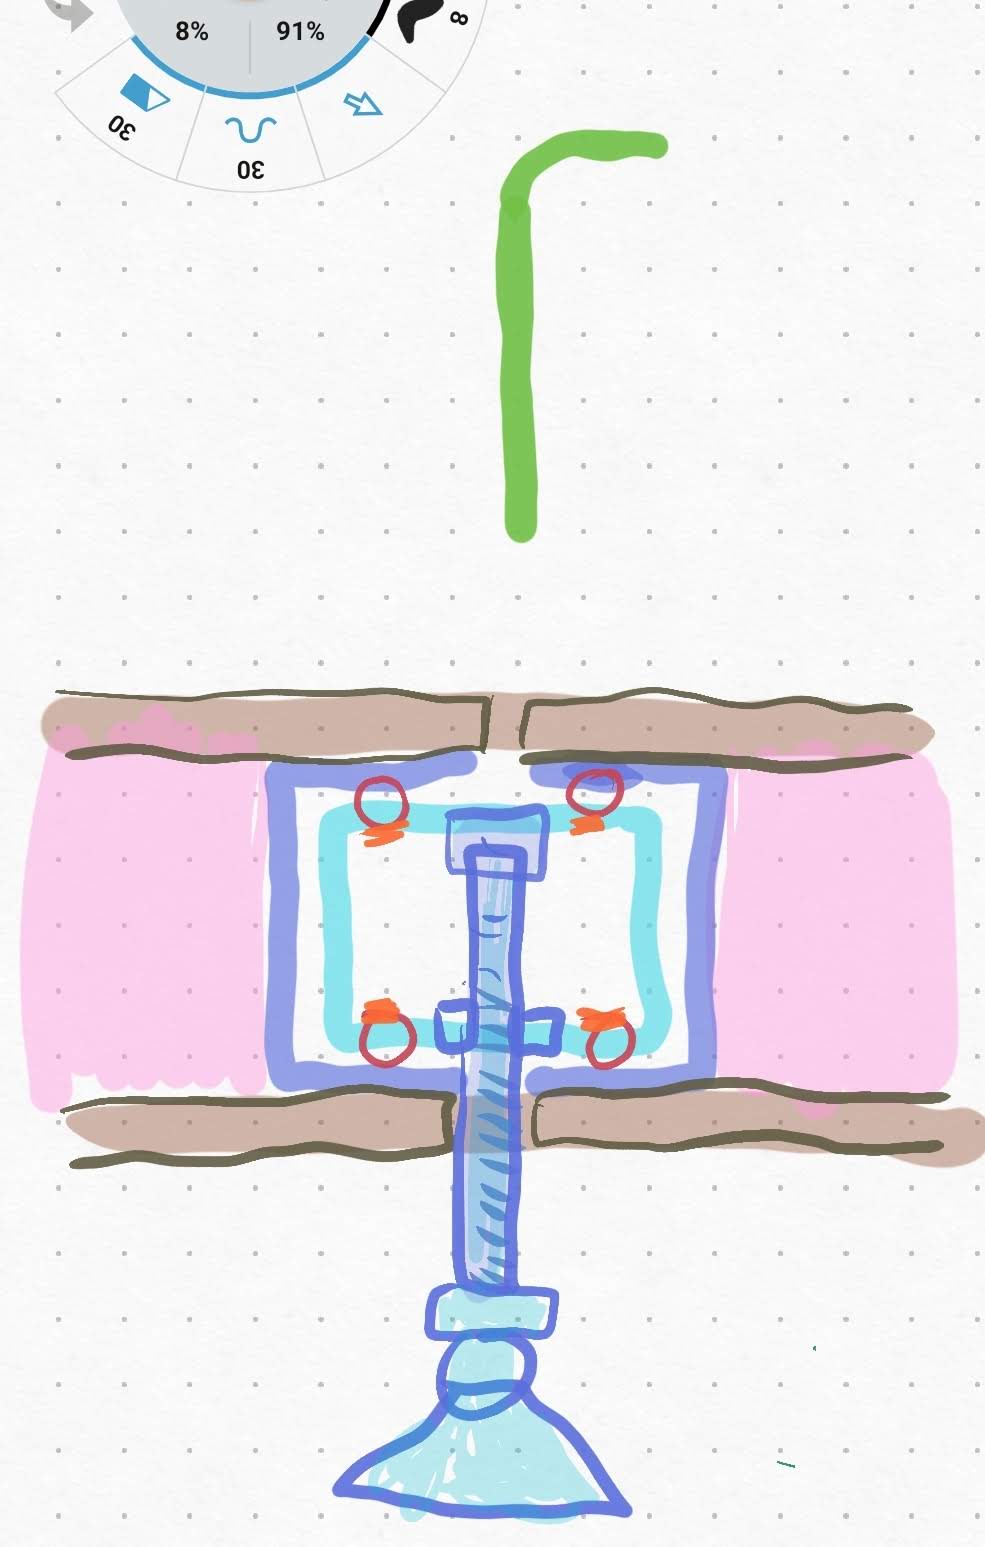
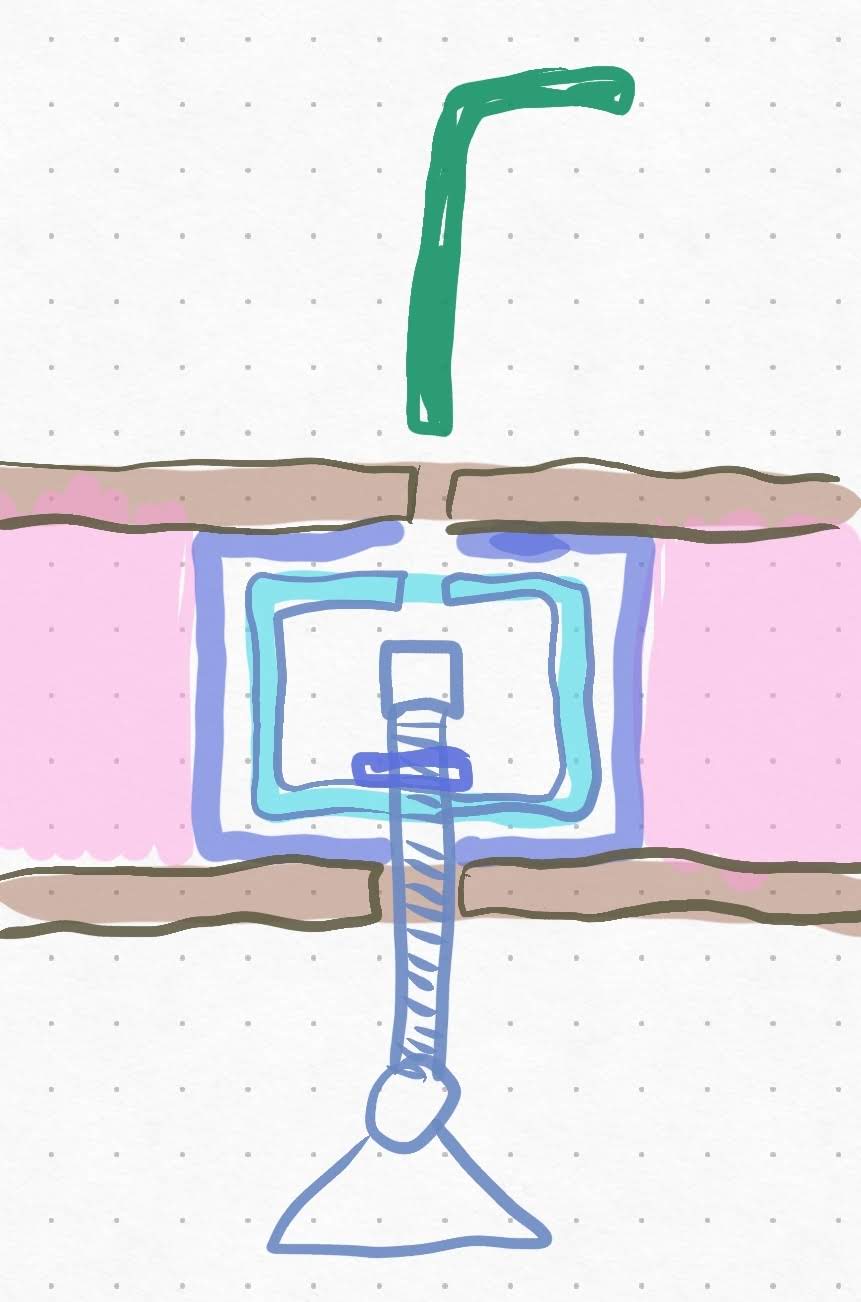
The leg structures were placed at the intersection of three panels and consisted of three pieces of steel box section fitted within aluminum U channels and welded at 120-degree increments to form a three-directional cross. A hole was left at the intersection, into which a threaded tube was welded. An internal hex bolt or long grub screw with a foot plate on the bottom was threaded into the tube and could be adjusted from above through a small hole in the stage using an allen key bit on an impact driver. This arrangement allowed for a quick and easy assembly process, with the legs being extended until they touched the ground to level the stage. The pieces were held together with inner steel box sections curved on the outer curved edges, and a large ratchet strap was used to wrap around the entire structure and compress the circle inward, pulling all the pieces together.
Overall, the design and construction of the circular stage was a challenging but rewarding project. We were able to meet all of the requirements set forth by the client and create a stage that was durable, stable, and easy to assemble and transport.
Mapping Wireless Coverage at the Royal Windsor Horse Show with ArcGIS
The Royal Windsor Horse Show is an annual event that attracts thousands of visitors and is the largest outdoor horse show in the United Kingdom. In order to ensure that the event runs smoothly, it is important to provide reliable connectivity to the staff and trader areas.
To achieve this, our team deployed a wireless network on the show grounds and created a heat map by taking geolocated signal strength readings on a smartphone from all over the site. This data was then uploaded into ArcGIS and used to create a heat map, which highlighted areas with weak signal strength or wireless black spots.
To help visualize the network and identify any potential issues, the heat map was overlaid on a georeferenced site map that showed the locations of wireless access points, cable routes, and network switch locations. By using this information, we were able to ensure that the staff and trader areas had the necessary connectivity to support the needs of the event.
Overall, the deployment of the wireless network at the Royal Windsor Horse Show was a success and played a vital role in the smooth running of the event. We are proud to have been able to support the needs of the staff and traders and help make the event a success.
Wireless Coverage at the Bath Festival - A Heatmap Analysis
At the Bath Festival, a small deployment of access points was placed around the tents to provide WiFi connectivity to attendees. In order to maximize coverage and ensure reliable connectivity, each access point was connected to a sector on an adjacent building via a point-to-point wireless link. In addition to the wireless link, each access point was also connected to a ADSL line and a temporary satellite on the roof to provide multiple redundant Internet connections.
To assess the performance of the access points and identify any areas with weak signal strength or wireless black spots, we used an Android app to collect a series of geolocated signal strength data points. These data points were formatted in Excel and then uploaded into ArcGIS, where a tool was used to create a heat map. This heat map was then overlayed over the site plan to provide a visual representation of the signal strength across the festival grounds.
By collecting and analyzing this data, we were able to identify any areas with weak signal strength or wireless black spots and take steps to improve coverage in these areas. This ensured that attendees were able to access the WiFi network and stay connected throughout the duration of the festival. By using a combination of a point-to-point wireless link, a ADSL line, and a temporary satellite, we were able to provide reliable and redundant Internet connectivity to the festival attendees.
Exploring the Unique Characteristics of Natural Building Materials
Inspired by the idea of using natural building materials, we set out to explore the unique characteristics and personalities of each material and use them in innovative ways in our design. We wanted to capture the mood and atmosphere of the natural environments where these materials are typically found, such as the underground world of stone and water or the airy heights of wood.
To this end, we experimented with lightweight hazel structures as a way to combine wood and air in our design. We were particularly interested in the underground world of stone and water, and decided to dig a tunnel into the side of a hill to see what we could discover. Unfortunately, the largest cavity we found was only two feet wide, and we had to come up with a different solution to support the roof of the tunnel. We ended up building concrete block load-bearing walls with concrete lintels supporting the stone above, which took up a lot of space and lost some of the rustic charm of our original design, but was necessary for safety.
According to our cross-sectional diagram, there is a third layer between the stone and wood in our design - a thin layer of mud from which all life springs. While we have not yet conducted extensive research on using mud as a building material, we have done extensive research and design work on the organic life that it can support. In our design, we envision the wood as the ideal location for sleeping quarters, warm and dry in the loft, while the ground floor would be reserved for the kitchen, toilet, and other organic activities, including food production. There may also be some kind of underground stone cavernous space beneath the building for an as-yet-unknown purpose.
Overall, our goal in this project was to use natural building materials in unique and innovative ways that captured the mood and atmosphere of the natural environments where these materials are typically found. While we encountered some challenges along the way, the process was exciting and rewarding, and we are proud of the design we have created.
Flood Risk Assessment of Pudding Brooke
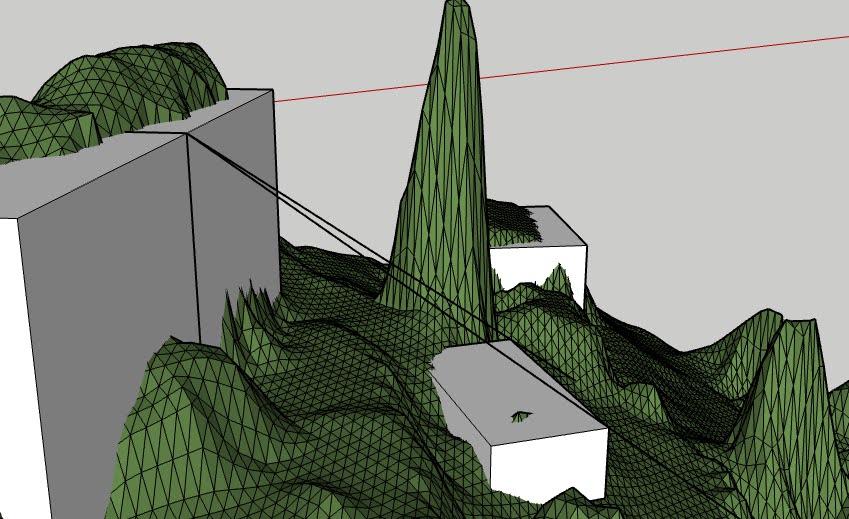
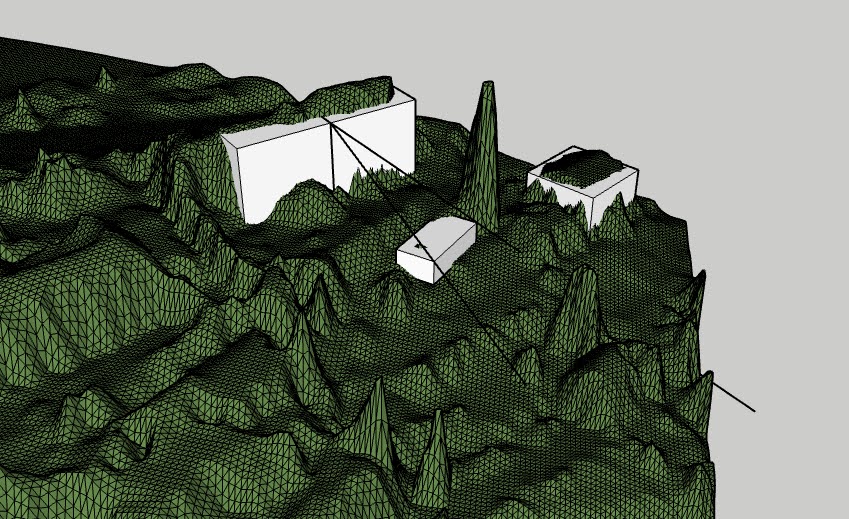
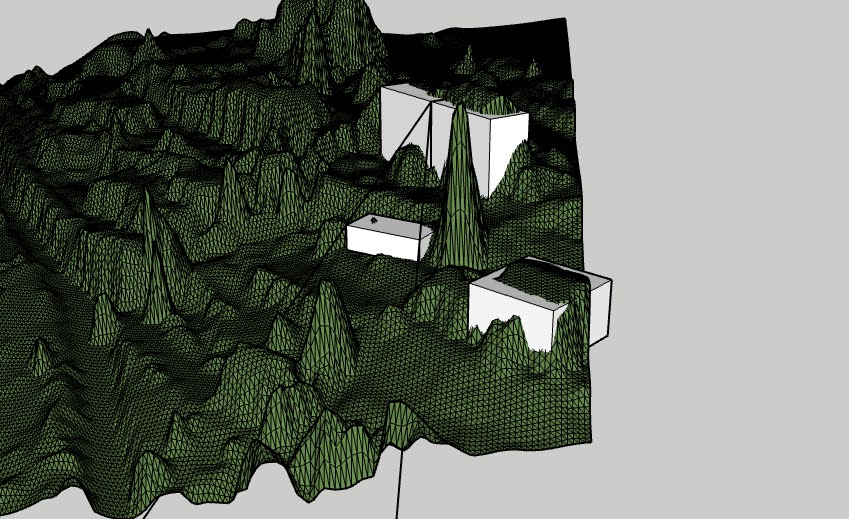
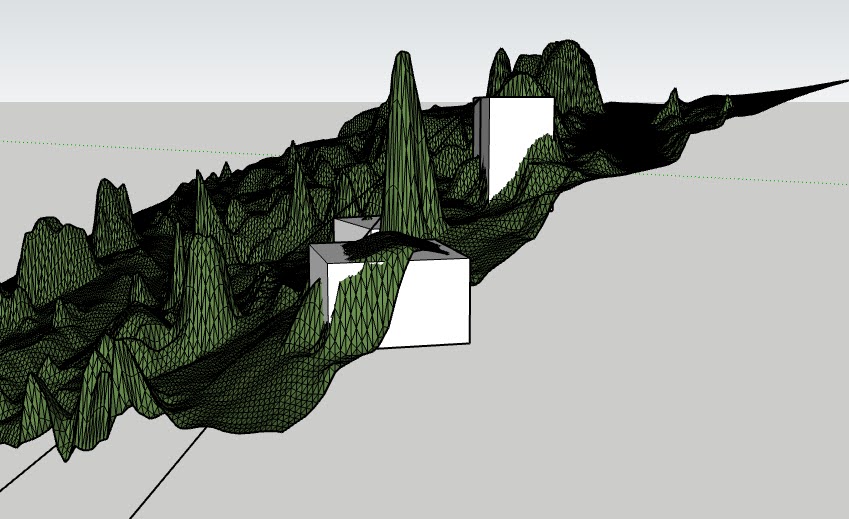
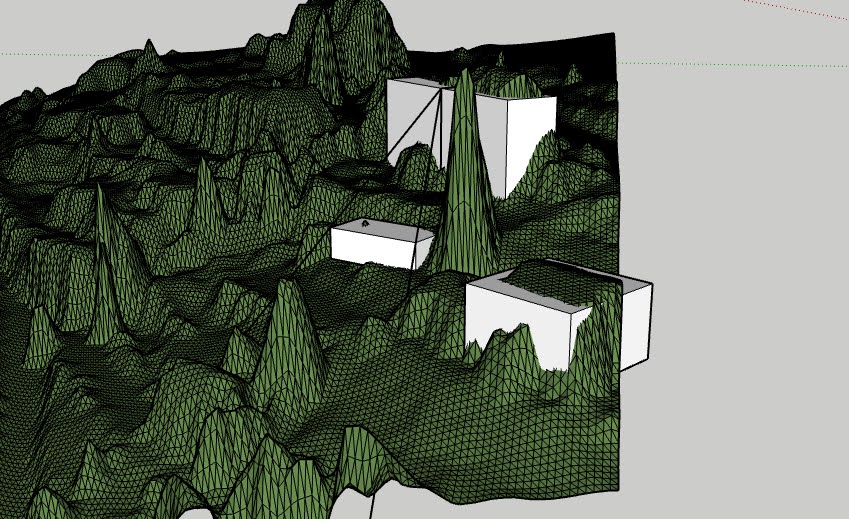
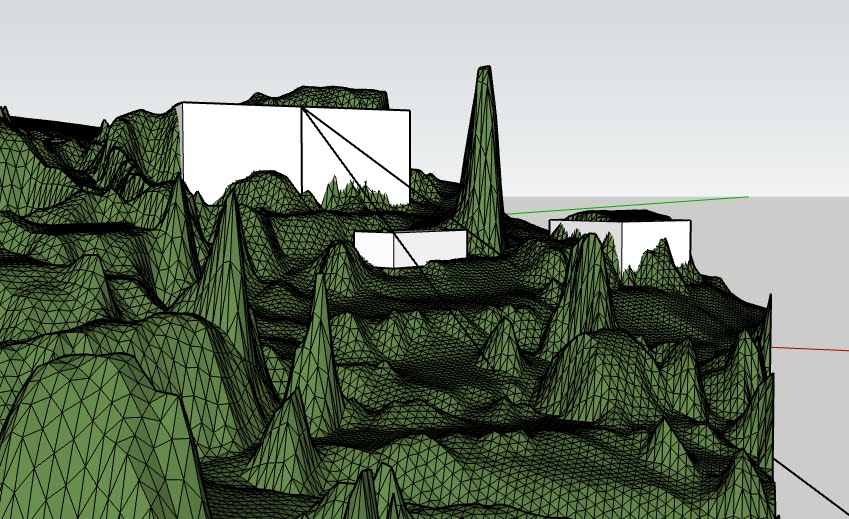
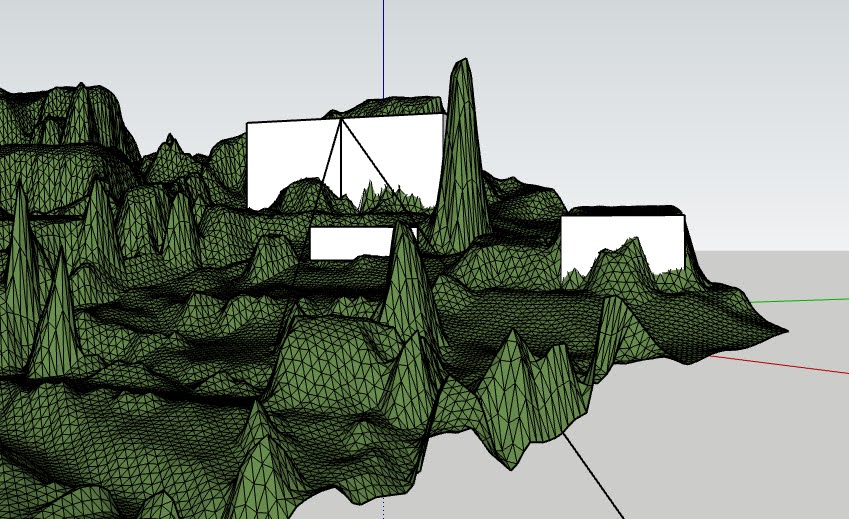
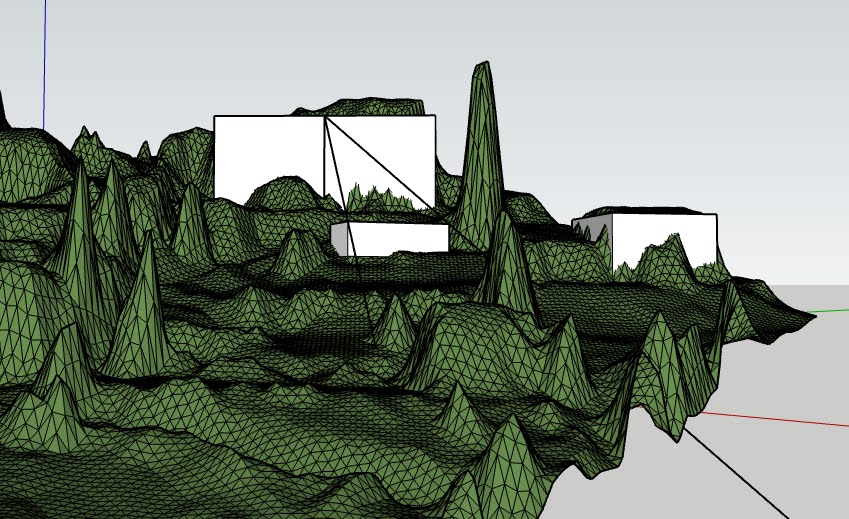
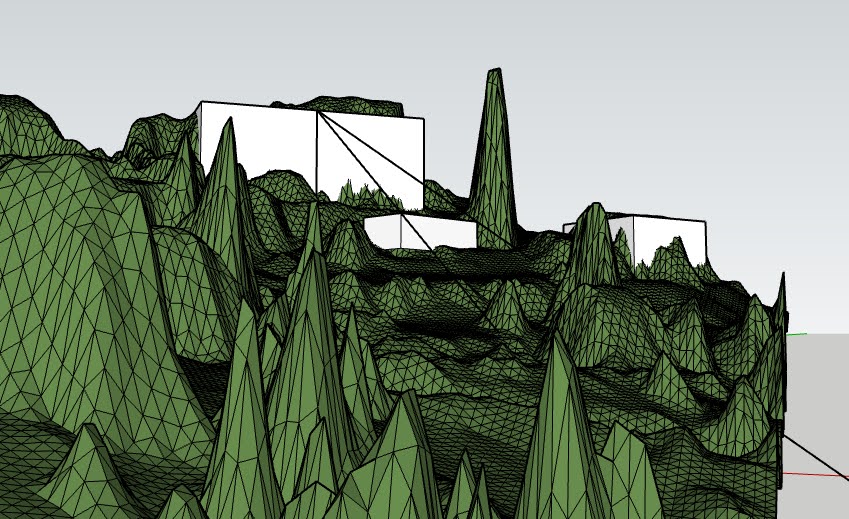
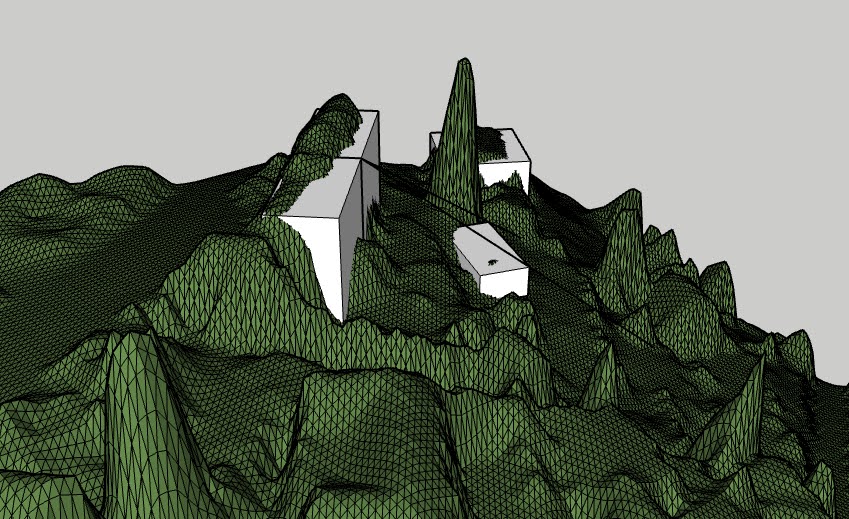
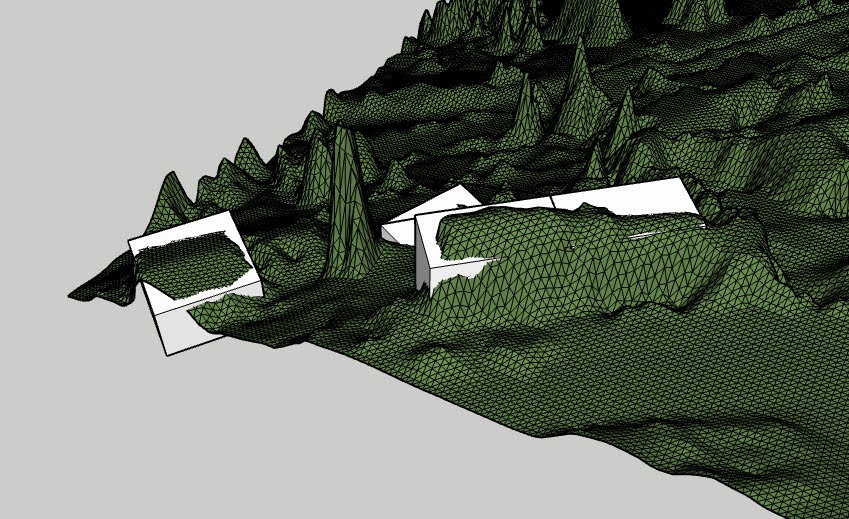
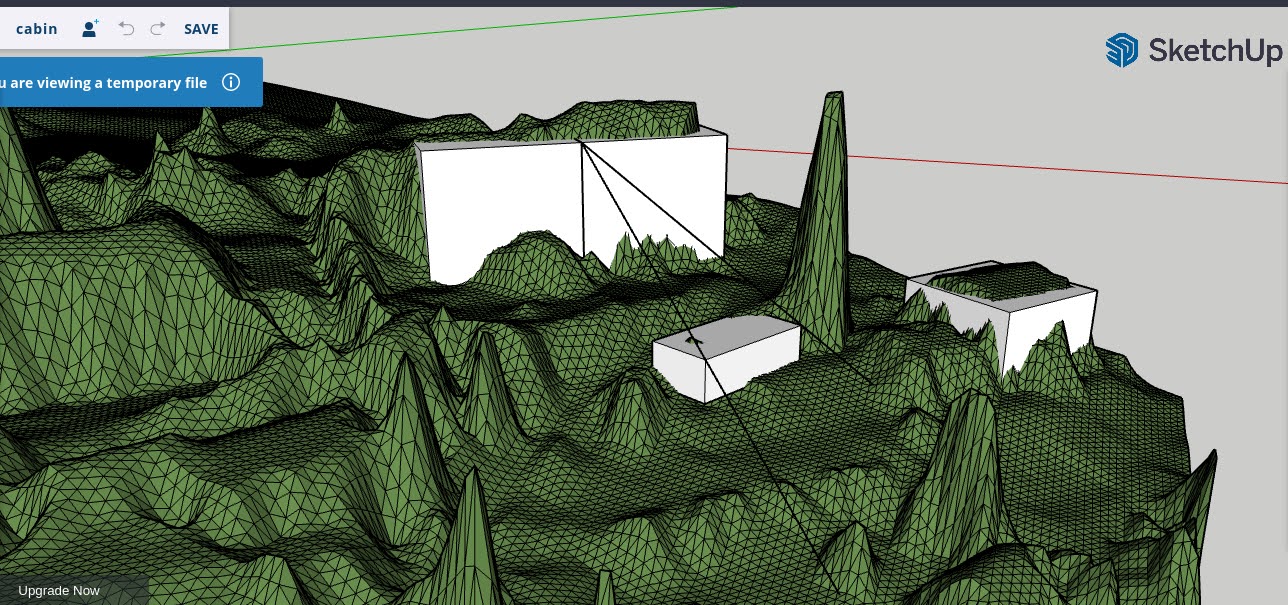
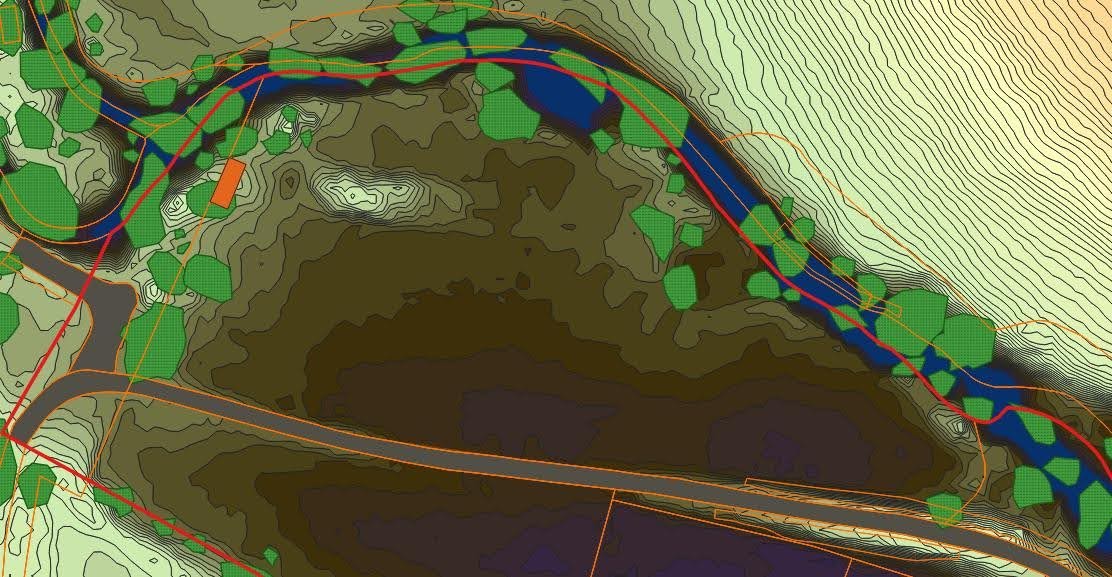
In order to assess the flood risk of Pudding Brooke, we first imported Digital Terrain Model LIDAR tiles into QGIS and used them to create contour polygons at 0.25m intervals. These contour polygons were then styled using a graduated color scheme, with each polygon being colored based on its elevation. This allowed us to easily visualize the topography of the area and identify areas that were prone to flooding.
After creating the contour polygons, we selected potential sites for outbuildings in appropriate high ground locations. This was an important step in the flood risk assessment process, as we needed to ensure that any new structures that were built would be situated on high ground and therefore less vulnerable to flooding. To identify suitable locations for outbuildings, we carefully evaluated the contour polygons and selected sites that were located on the highest ground available.
Overall, the use of Digital Terrain Model LIDAR tiles and contour polygons was essential in helping us to accurately assess the flood risk of Pudding Brooke and identify suitable sites for outbuildings. By carefully analyzing the topography of the area, we were able to make informed decisions about where it was safe to build, ensuring that any new structures would be protected from potential flooding.