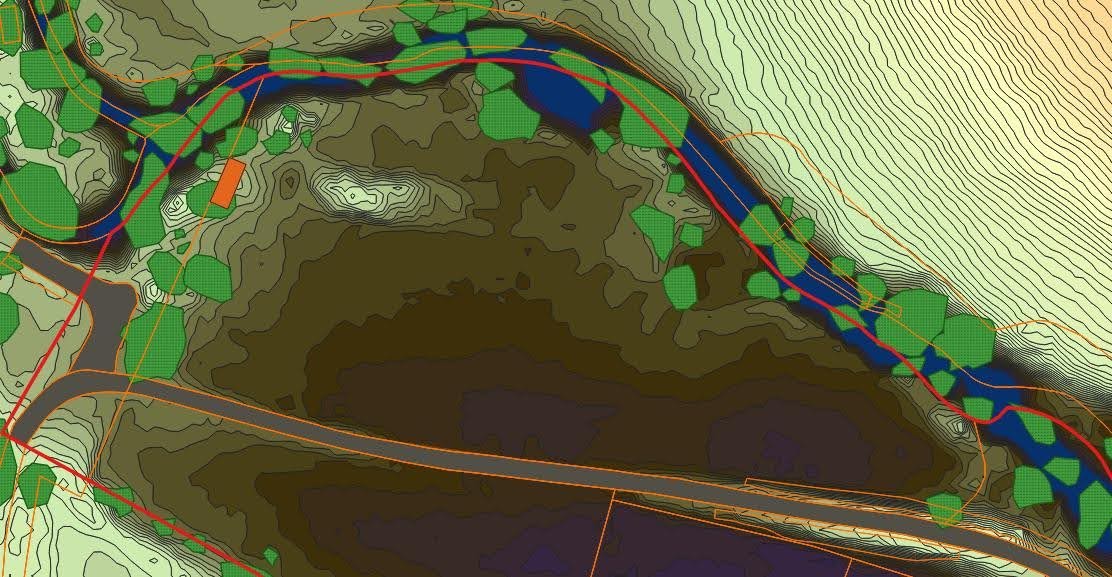
In order to assess the flood risk of Pudding Brooke, we first imported Digital Terrain Model LIDAR tiles into QGIS and used them to create contour polygons at 0.25m intervals. These contour polygons were then styled using a graduated color scheme, with each polygon being colored based on its elevation. This allowed us to easily visualize the topography of the area and identify areas that were prone to flooding.
After creating the contour polygons, we selected potential sites for outbuildings in appropriate high ground locations. This was an important step in the flood risk assessment process, as we needed to ensure that any new structures that were built would be situated on high ground and therefore less vulnerable to flooding. To identify suitable locations for outbuildings, we carefully evaluated the contour polygons and selected sites that were located on the highest ground available.
Overall, the use of Digital Terrain Model LIDAR tiles and contour polygons was essential in helping us to accurately assess the flood risk of Pudding Brooke and identify suitable sites for outbuildings. By carefully analyzing the topography of the area, we were able to make informed decisions about where it was safe to build, ensuring that any new structures would be protected from potential flooding.