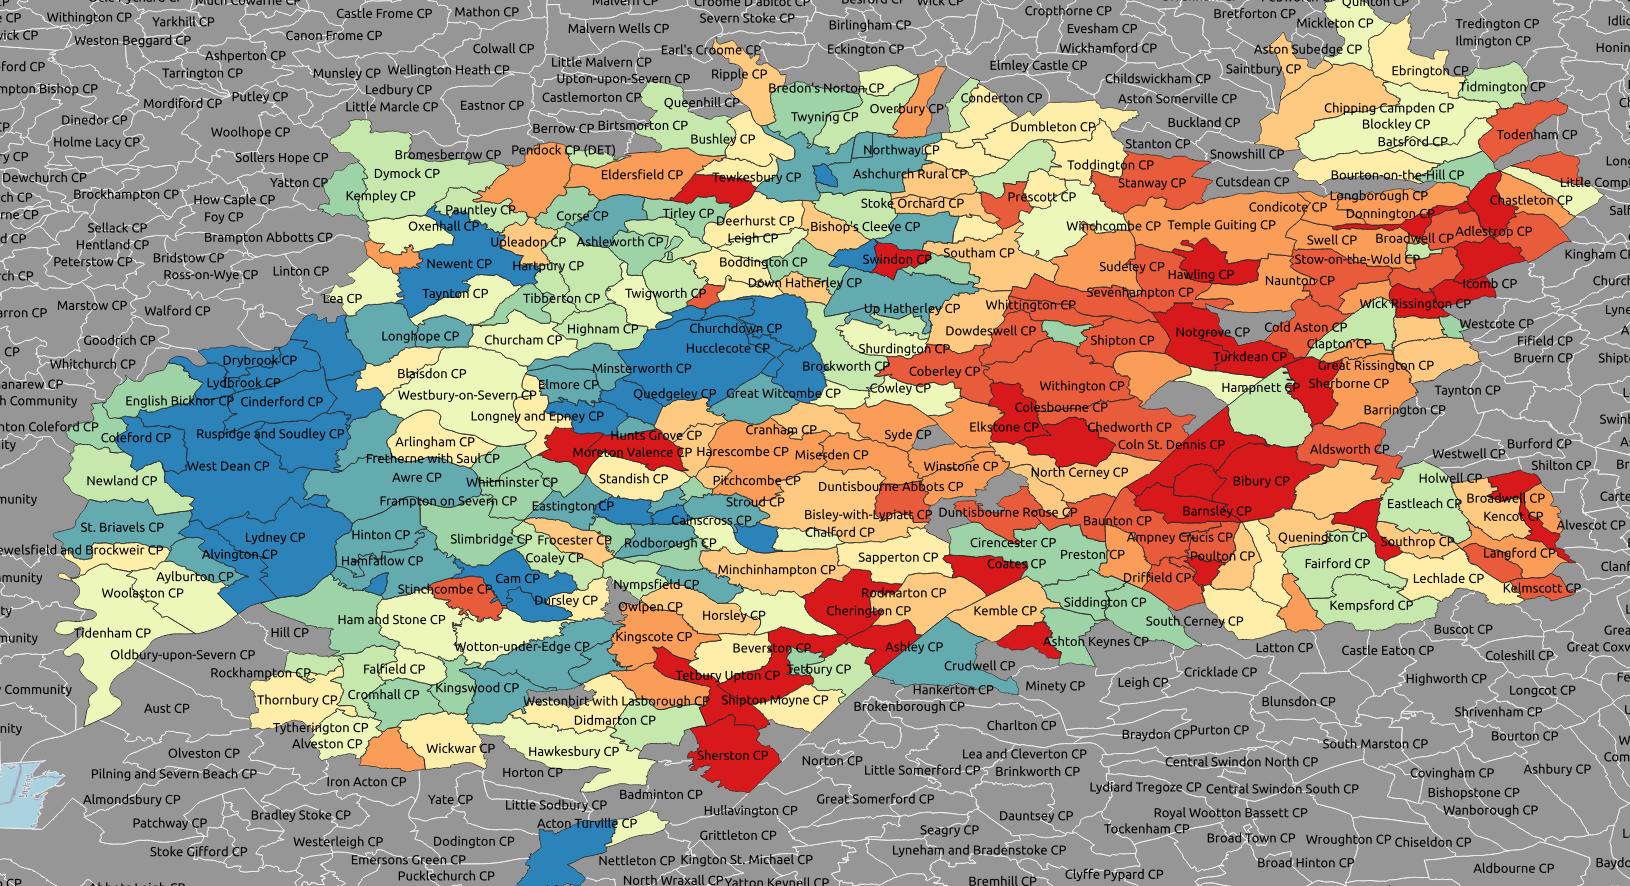
In order to accurately assess the real estate market, our team utilized property sale data from the land registry and postal code data from the Ordnance Survey to determine the latitude and longitude coordinates of each house sale. This data was then imported into a PostGIS database, where an SQL query was run to calculate the average home price for each parish. To facilitate the visualization and analysis of this information, we utilized the powerful mapping software QGIS. By coloring the polygons representing each parish based on the average price, we were able to clearly and intuitively display the variations in the housing market across the region.
This process allowed us to gain a detailed and nuanced understanding of the real estate market, and to identify trends and patterns that would not have been immediately apparent without the use of spatial analysis. By combining the robust data management capabilities of PostGIS with the intuitive mapping capabilities of QGIS, we were able to effectively and efficiently analyze complex data sets and extract valuable insights.