
· One min read

Wireless access points and point-to-point links have been installed on the aluminum extrusion structural elements of outdoor event marquees using a innovative system that employs a keeder rail. The keeder rail accommodates a cylindrical metal piece with a threaded hole drilled perpendicular to its length, which can be easily secured in place by turning a large, flat disk with a threaded hole in the center. This setup supports a pipe clamp that is designed to fit standard aluminum poles, with two clamps used per pole to securely anchor the pole vertically on the side of the tent. This innovative method of installation allows for reliable and secure connectivity during events, while also maintaining the aesthetic integrity of the marquees.

Docusaurus Plushie

Docusaurus Plushie

· One min read

As part of this deployment project, our team encountered a physically demanding challenge: the installation of two sectors on the 18th floor of a tower block adjacent to the event site. From this vantage point, we were able to transmit a strong signal to multiple wireless point-to-point stations attached to temporary structures and buildings within the site. Additionally, we provided indoor wireless coverage in an underground parking garage that served as one of the event venues. To ensure optimal coverage, we created a heat map of the wireless signal strength in this area. Moreover, we established uplinks at various locations throughout the site to support ticket booths, CCTV cameras, payment terminals for bars, a production office, and emergency liaison cabins. Overall, this comprehensive approach to wireless connectivity allowed for seamless communication and connectivity throughout the event.

· 2 min read

As engineers and designers, it is our duty to create structures that not only function well, but also enhance the lives of those who use them. This is particularly important in the design of motor caravans, which serve as both vehicles and living spaces for travelers. With this in mind, we set out to design a caravan that prioritized both comfort and practicality.

The first step in our process was to choose the most suitable materials and construction techniques. We decided to use a thick layer of spray foam as the foundation for the caravan's shape, which was then carved back to the desired form and rendered with acrylic putty. This method allowed us to create a strong and lightweight structure, while also providing excellent insulation to keep the interior comfortable.

Next, we focused on the layout of the interior space. We installed a single bed lengthways, with a desk running parallel to it. This arrangement allowed for maximum use of the limited space, while also providing a comfortable and functional sleeping and working area. In addition, we designed the layout in such a way that the user can easily walk from the back of the caravan to the side door unhindered, which gives flexibility in terms of access and egress.

To ensure practicality, we also included a bulkhead kitchen with a water-saving faucet, a full-size fridge, and a hob. These features allow the user to easily prepare meals and store food while on the road. We also installed double-layered Ikea blackout blinds and windows all around to provide privacy and regulate light and temperature within the caravan.

Overall, our design for this motor caravan prioritizes both comfort and practicality, making it an ideal living space for travelers. By carefully considering the materials, layout, and features, we have created a functional and enjoyable space that will enhance the experience of those who use it.

Docusaurus Plushie Docusaurus Plushie Docusaurus Plushie Docusaurus Plushie Docusaurus Plushie Docusaurus Plushie Docusaurus Plushie Docusaurus Plushie Docusaurus Plushie Docusaurus Plushie Docusaurus Plushie Docusaurus Plushie Docusaurus Plushie

· One min read

In order to accurately assess the real estate market, our team utilized property sale data from the land registry and postal code data from the Ordnance Survey to determine the latitude and longitude coordinates of each house sale. This data was then imported into a PostGIS database, where an SQL query was run to calculate the average home price for each parish. To facilitate the visualization and analysis of this information, we utilized the powerful mapping software QGIS. By coloring the polygons representing each parish based on the average price, we were able to clearly and intuitively display the variations in the housing market across the region.

This process allowed us to gain a detailed and nuanced understanding of the real estate market, and to identify trends and patterns that would not have been immediately apparent without the use of spatial analysis. By combining the robust data management capabilities of PostGIS with the intuitive mapping capabilities of QGIS, we were able to effectively and efficiently analyze complex data sets and extract valuable insights.

Docusaurus Plushie

· One min read

Docusaurus Plushie

If a mirror is positioned on the surface of a sphere and is perpendicular to a line that extends from the center of the sphere to a point on the surface of the sphere, light from outside the sphere that is directed towards the mirror will be reflected off the mirror's surface and into the center of the sphere.

Docusaurus Plushie

Docusaurus Plushie

· 2 min read

Prepare prices data

In order to effectively analyze and visualize real estate data, it is important to first properly organize and process the data. To this end, our team combined three separate files containing price paid data into a single file and cleaned and filtered the data through a series of steps. These steps included the removal of quotes, the selection of only rows with "GL" followed by a number, the printing of certain columns, the addition of column names, and the deletion of rows with null values.

Once the data was cleaned and organized, we used the powerful tool ogr2ogr to convert a file with cadastral parcel information into a PostgreSQL file. We then changed the projection from OSGB to WGS84 and imported it into a database. In order to store the data in a structured manner, we started a psql session and created empty tables with certain columns in the database.

Next, we used the \copy command and SQL JOIN to combine the price and coordinates data based on their shared postcodes. We added a column for geometry data and used the latitude and longitude data to create points. We then calculated the average value for each of the duplicate polygons.

Finally, we used the powerful mapping software QGIS to export the table from the database and modified the layer properties for visual appeal. Through this process, we were able to effectively organize and analyze the real estate data, allowing us to extract valuable insights and gain a deeper understanding of the market.

Docusaurus Plushie

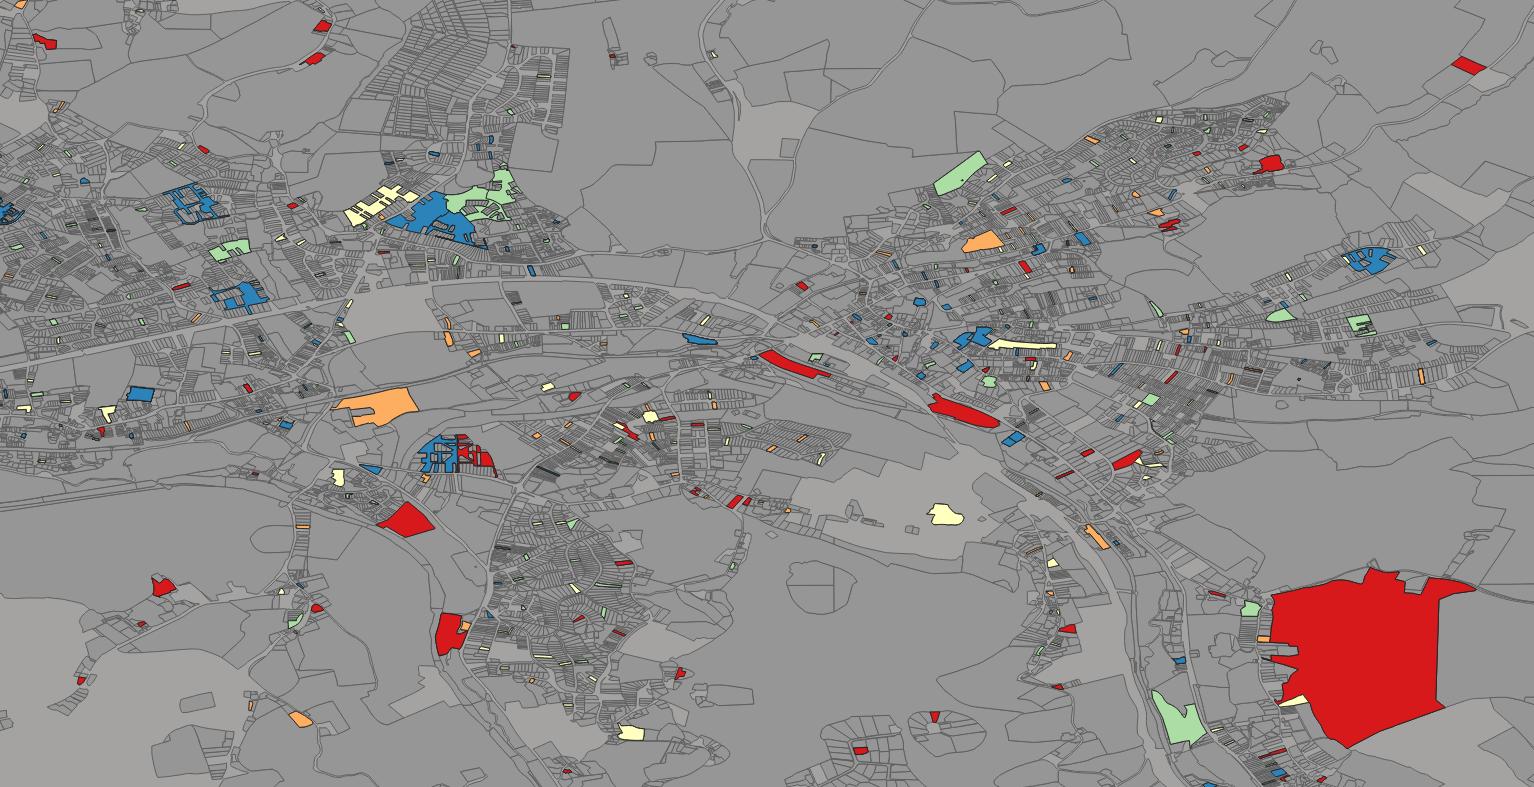
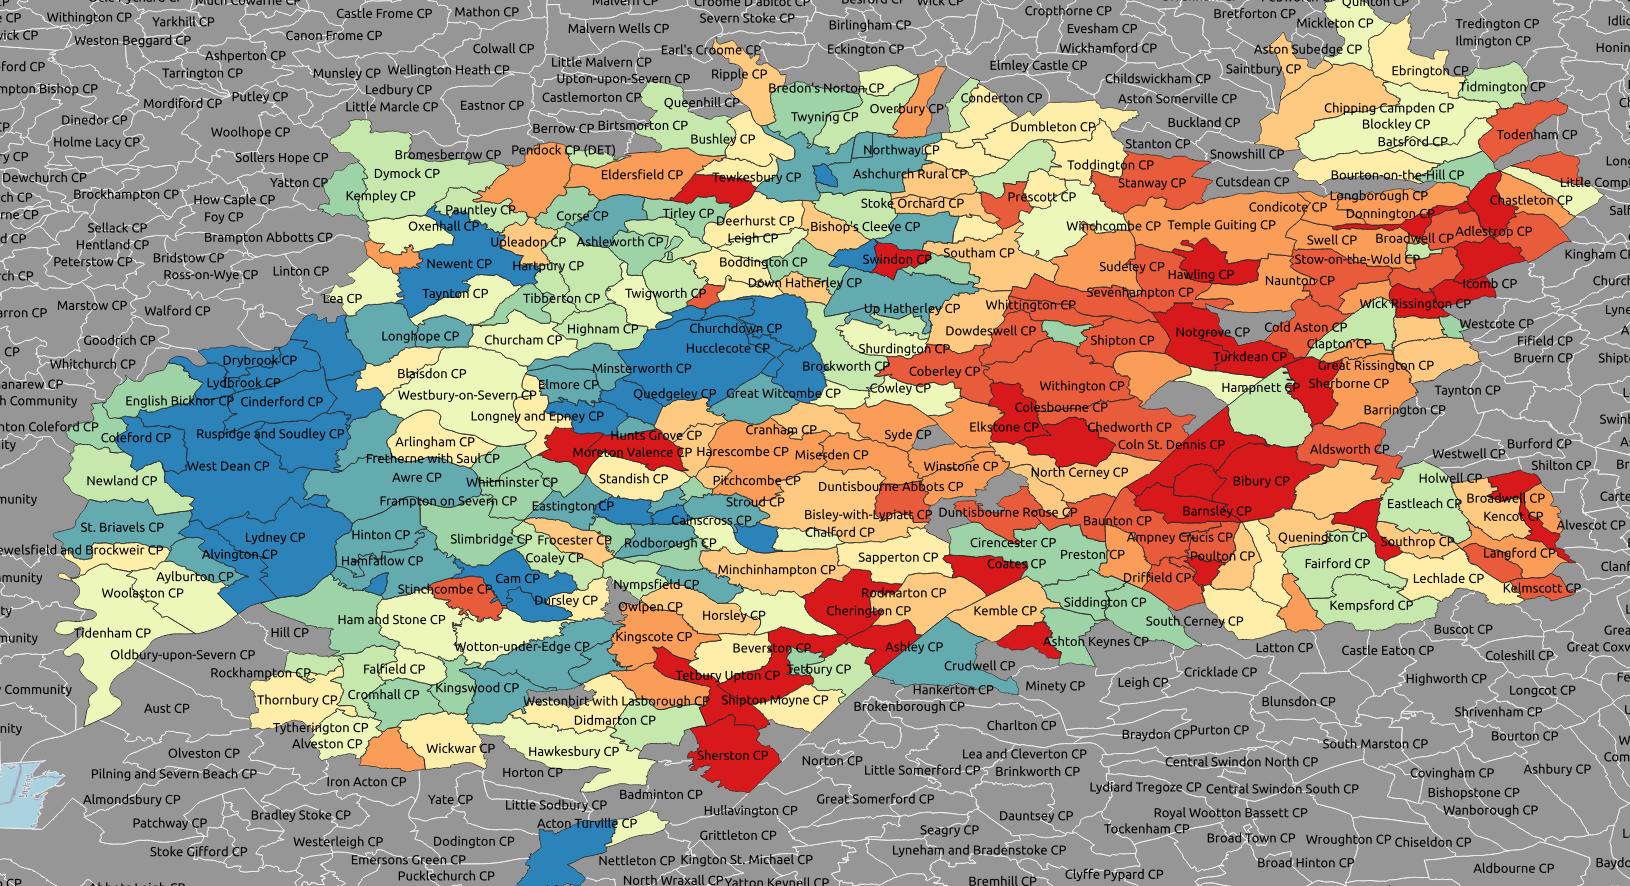
During our analysis of real estate data, we encountered an issue with some of the postal codes not being properly associated with the intended polygons. This issue had the potential to significantly impact the accuracy and usefulness of our data.

To address this issue and improve the accuracy of our data, we decided to use a different set of polygons (parishes) with a lower resolution for the next project. We hoped that this approach would help to more accurately associate the postal codes with the intended polygons, resulting in a more reliable dataset.

· 2 min read

As engineers and designers, we are often approached with unusual and challenging requests. One such request came from an artist who asked us to help find a suitable geometry for a large egg sculpture. Intrigued by the opportunity to collaborate with an artist and apply our skills in a creative context, we set out to identify possible geometries using generative algorithms in Grasshopper 3D.

The first step in our process was to understand the constraints and requirements of the project. The artist provided us with a set of parameters, including the desired size and shape of the sculpture, as well as the materials that would be used to construct it. With this information in hand, we began to explore different algorithmic approaches that could be used to generate a range of possible geometries.

We turned to Grasshopper 3D, a powerful tool for generative design that allows users to define and manipulate geometry through a series of algorithmic rules. Using a combination of mathematical functions and input from the artist, we were able to generate a range of potential geometries for the egg sculpture.

To narrow down our options and select the most suitable geometry, we used a variety of methods to evaluate and compare the different options. We considered factors such as structural integrity, ease of fabrication, and aesthetic appeal, and used computer simulations and physical prototypes to test the performance of the different geometries.

In the end, we were able to identify a geometry that met all of the requirements and constraints of the project. The artist was pleased with the result and used our geometry to create a stunning egg sculpture that was well-received by the public.

This project was a rewarding and exciting example of the ways in which engineering and design can intersect with the arts. By using generative algorithms and a collaborative approach, we were able to help an artist realize their vision and create a beautiful work of art.

Docusaurus Plushie

Docusaurus Plushie

· 2 min read

In this project, we aimed to successfully install and configure the Cisco Catalyst c9800-CL wireless controller using KVM (Kernel-based Virtual Machine). The c9800-CL is a powerful and flexible cloud-based wireless controller that is capable of managing both on-premises and cloud-based wireless networks. It belongs to the Cisco Catalyst 9800 series and offers a range of advanced features such as wireless intrusion prevention, location services, and guest access.

To begin, we installed virtualization software and enabled the libvirtd service on our system. This allowed us to create and manage virtual machines using KVM. We then created a network bridge using the brctl command, which enabled communication between the virtual machine and the host system.

With the necessary infrastructure in place, we used the virt-install command to install the c9800-CL on a new virtual machine. During the installation process, we specified a number of options such as the connection to the virtualization server, the operating system variant, the architecture of the virtual machine, and the CPU type.

Once the virtual machine was set up and the c9800-CL was installed, we provided a script to configure the controller. This script contained a series of steps that were necessary to properly set up the c9800-CL. These steps included setting the hostname, creating a user account, configuring the Gigabit Ethernet interfaces, creating a VLAN, setting up static routes, shutting down and re-enabling the radio frequencies, and setting the country code. We also configured the virtual wireless LAN controller (VWLC) and set the DNS and NTP servers to ensure proper network connectivity and synchronization.

Finally, we demonstrated how to access the GUI of the c9800-CL at the specified IP address and walk through the zero-day configuration steps to set up a wireless network. By following these steps, users can easily configure the c9800-CL to meet the specific needs of their wireless network.

· 2 min read

Docusaurus Plushie

In this project, we designed and fabricated a dodecahedron-shaped structural node for use in a truss system. A truss is a structural element that consists of a series of interconnected struts, which work together to distribute loads evenly and maintain the stability and strength of the structure. The node we created had 12 pentagonal faces, and each truss strut was attached to the center of one of these faces via a single bolt. This bolt passed through a hole in the center of the end cap of the strut and was secured in place by screwing it into a threaded hole in the center of the dodecahedron face.

The node was made of steel and was designed to resist the forces transmitted through the truss. Its dodecahedron shape and the use of a single bolt per strut allowed for a high level of flexibility and adaptability, as the struts could be easily rearranged or removed due to their modular design. This feature made the node a crucial element in the overall design of the truss, as it enabled the structure to be easily modified or altered to meet changing needs or requirements.

Overall, the dodecahedron-shaped structural node we created proved to be an effective and efficient solution for joining multiple truss struts together at a single point. It played a vital role in distributing loads evenly and maintaining the stability and strength of the truss, and its modular design allowed for flexibility and adaptability in the overall structure.

Docusaurus Plushie

Docusaurus Plushie

· 2 min read

The Ordnance Survey Mastermap Topography Layer, the Building Height Attribute (BHA), and the Environment Agency LiDAR Digital Terrain Model (DTM) are all useful data sources that can be used to create 3D models of buildings. By combining this data and using the Qgis2ThreeJS plugin in QGIS, it is possible to visualize the BHA data in 3D and create a 3D model of a building.

To do this, the Qgis2ThreeJS plugin must be installed and the BHA data, DTM data, and any additional desired layers must be loaded into the QGIS project. The plugin can then be used to style the BHA data and specify the desired height attribute for extrusion, resulting in a 3D model of the building. This model can be saved as an HTML file and viewed in a web browser.

When combined with the LiDAR DTM, the resulting 3D model is fairly accurate and can be opened in Grasshopper, a visual programming language and environment that runs within the Rhinoceros 3D CAD application. With the addition of the Ladybug plugin, this 3D model can be used to perform detailed analyses of climate data and create customized, interactive visualizations for environmentally-informed design, such as sunlight studies.

Docusaurus Plushie Docusaurus Plushie Docusaurus Plushie Docusaurus Plushie Docusaurus Plushie Docusaurus Plushie Docusaurus Plushie Docusaurus Plushie Docusaurus Plushie Docusaurus Plushie Docusaurus Plushie Docusaurus Plushie

References

qgis bha