
8 posts tagged with "hello"

View All Tags

· 2 min read

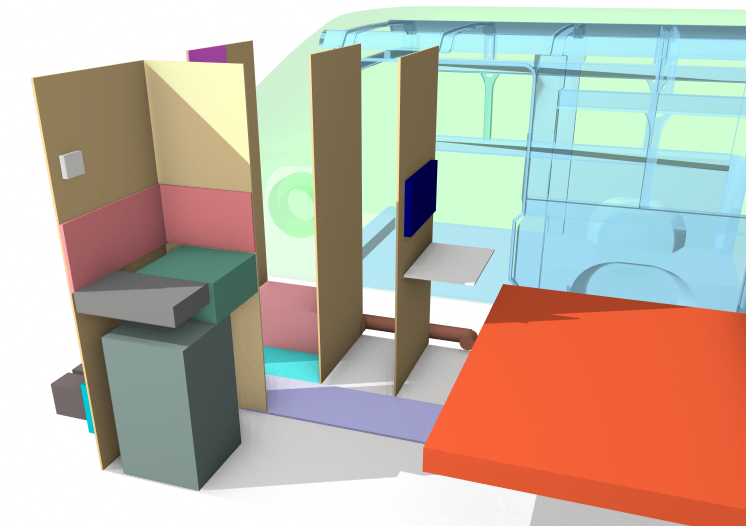
As engineers and designers, it is our duty to create structures that not only function well, but also enhance the lives of those who use them. This is particularly important in the design of motor caravans, which serve as both vehicles and living spaces for travelers. With this in mind, we set out to design a caravan that prioritized both comfort and practicality.

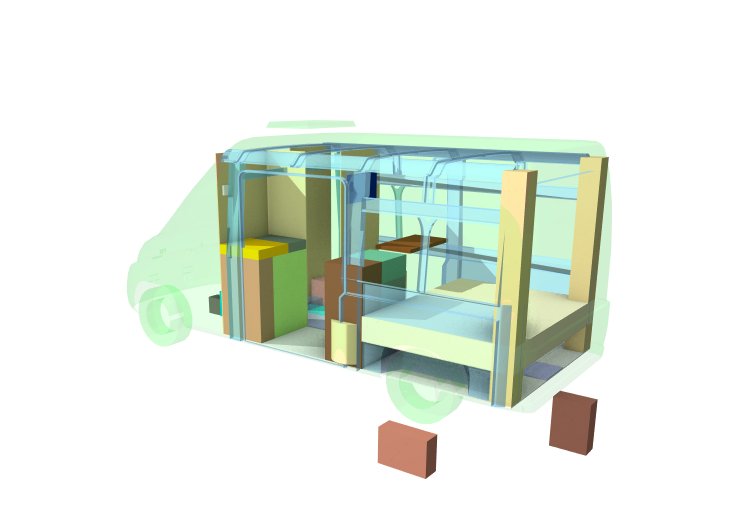
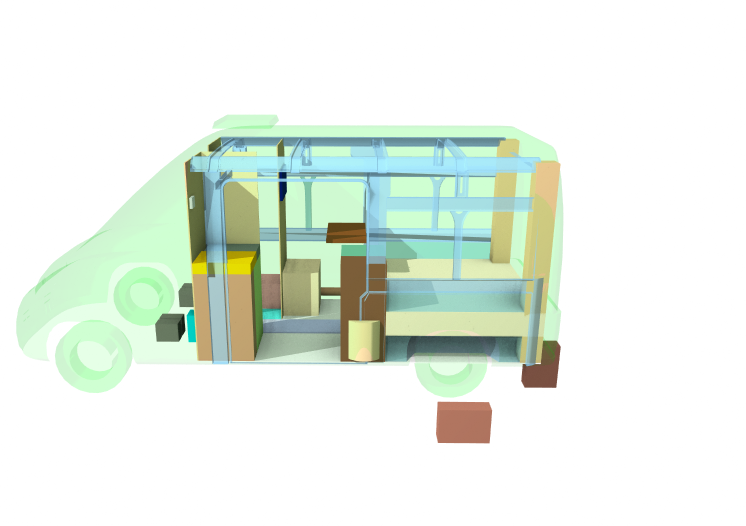
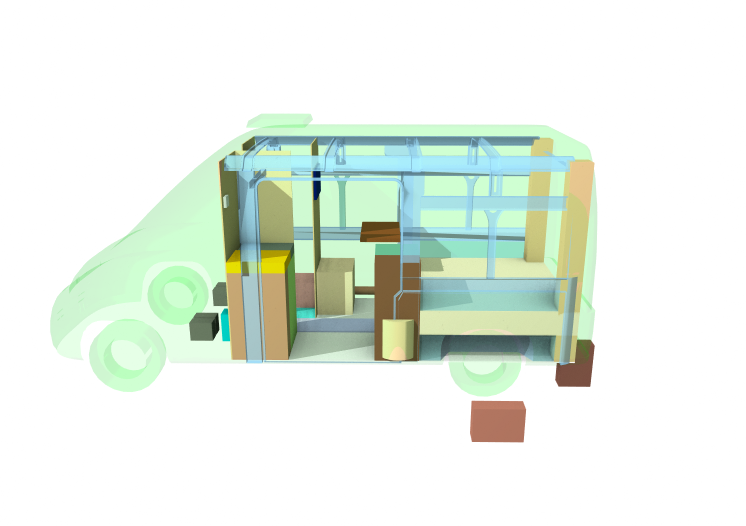
The first step in our process was to choose the most suitable materials and construction techniques. We decided to use a thick layer of spray foam as the foundation for the caravan's shape, which was then carved back to the desired form and rendered with acrylic putty. This method allowed us to create a strong and lightweight structure, while also providing excellent insulation to keep the interior comfortable.

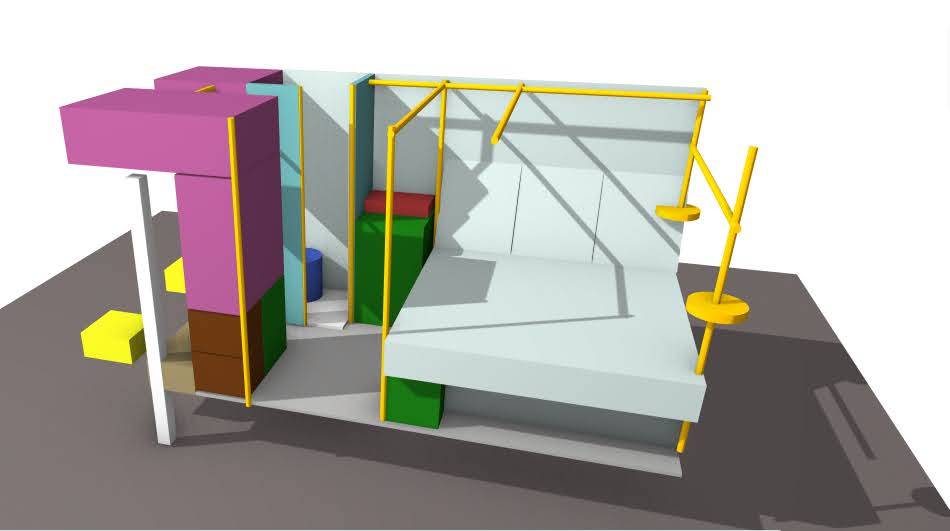
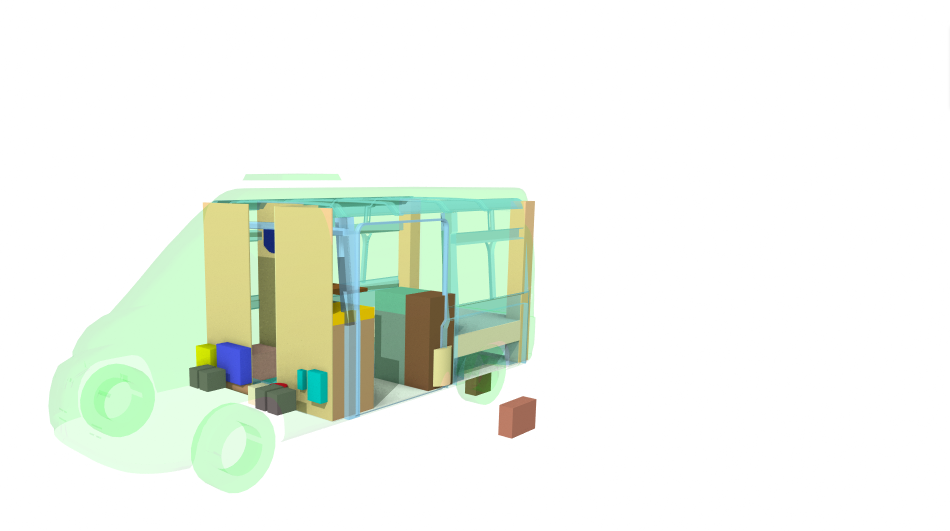
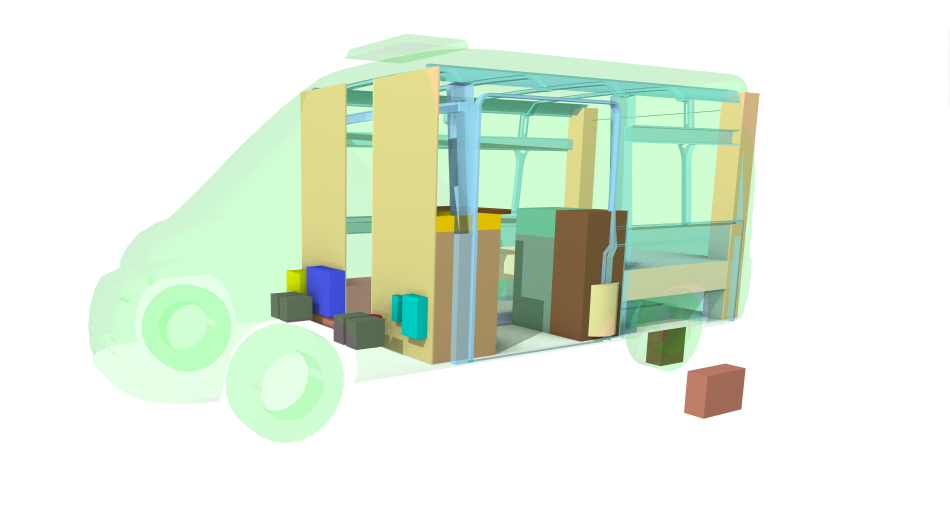
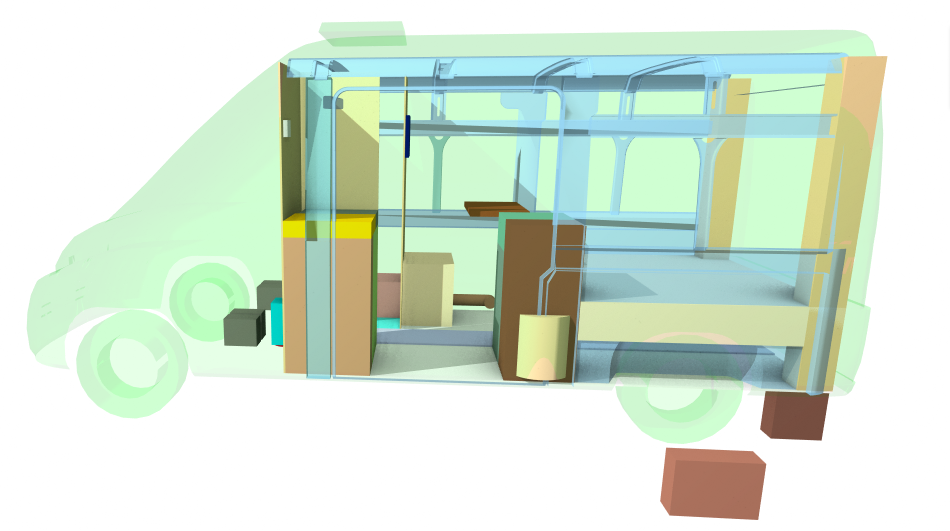
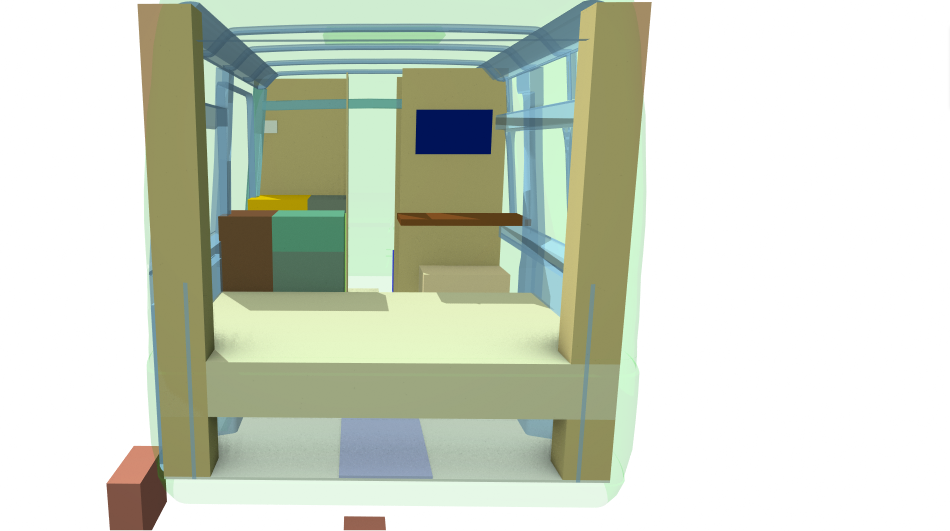
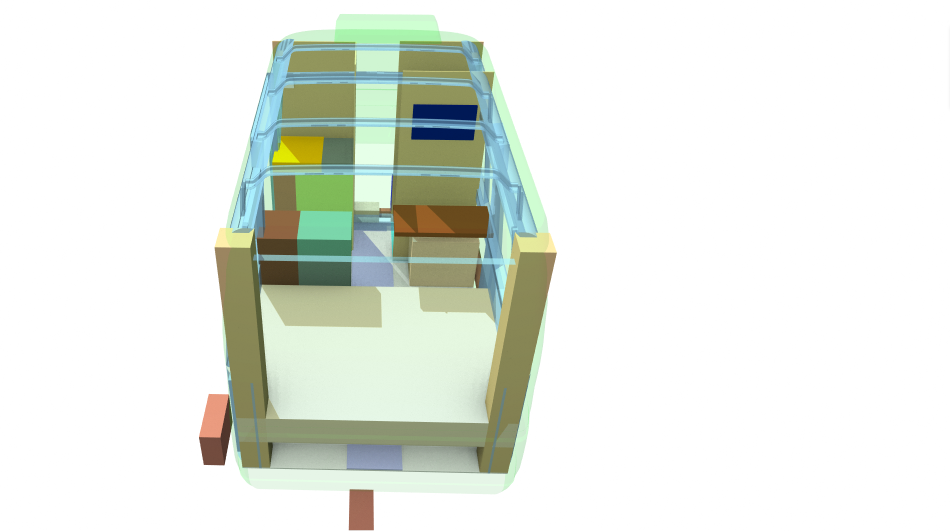
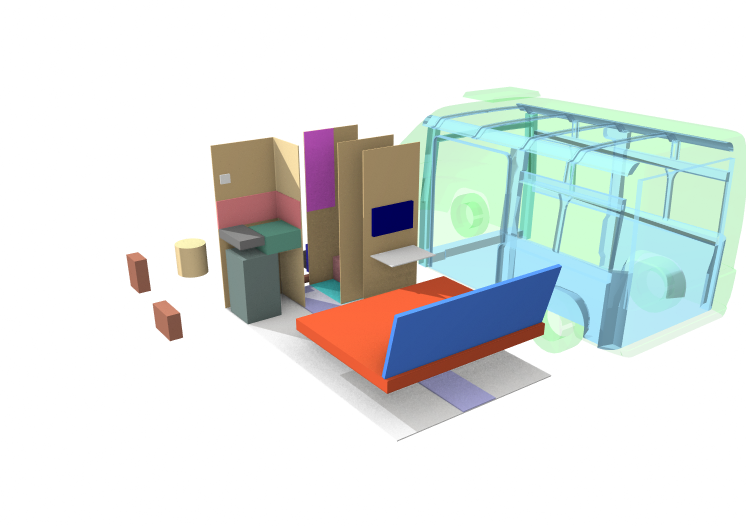
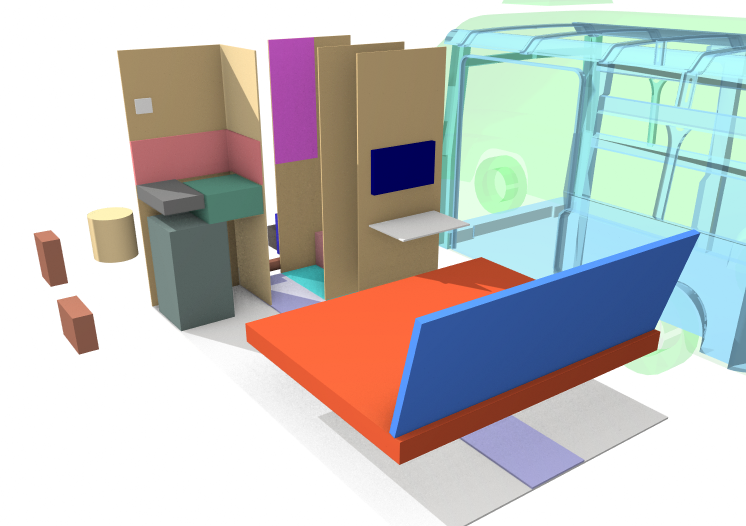
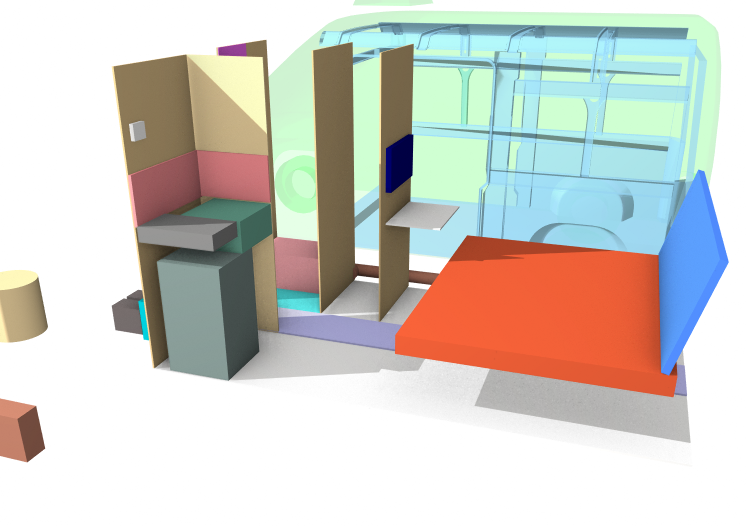
Next, we focused on the layout of the interior space. We installed a single bed lengthways, with a desk running parallel to it. This arrangement allowed for maximum use of the limited space, while also providing a comfortable and functional sleeping and working area. In addition, we designed the layout in such a way that the user can easily walk from the back of the caravan to the side door unhindered, which gives flexibility in terms of access and egress.

To ensure practicality, we also included a bulkhead kitchen with a water-saving faucet, a full-size fridge, and a hob. These features allow the user to easily prepare meals and store food while on the road. We also installed double-layered Ikea blackout blinds and windows all around to provide privacy and regulate light and temperature within the caravan.

Overall, our design for this motor caravan prioritizes both comfort and practicality, making it an ideal living space for travelers. By carefully considering the materials, layout, and features, we have created a functional and enjoyable space that will enhance the experience of those who use it.

Docusaurus Plushie Docusaurus Plushie Docusaurus Plushie Docusaurus Plushie Docusaurus Plushie Docusaurus Plushie Docusaurus Plushie Docusaurus Plushie Docusaurus Plushie Docusaurus Plushie Docusaurus Plushie Docusaurus Plushie Docusaurus Plushie

· One min read

In order to accurately assess the real estate market, our team utilized property sale data from the land registry and postal code data from the Ordnance Survey to determine the latitude and longitude coordinates of each house sale. This data was then imported into a PostGIS database, where an SQL query was run to calculate the average home price for each parish. To facilitate the visualization and analysis of this information, we utilized the powerful mapping software QGIS. By coloring the polygons representing each parish based on the average price, we were able to clearly and intuitively display the variations in the housing market across the region.

This process allowed us to gain a detailed and nuanced understanding of the real estate market, and to identify trends and patterns that would not have been immediately apparent without the use of spatial analysis. By combining the robust data management capabilities of PostGIS with the intuitive mapping capabilities of QGIS, we were able to effectively and efficiently analyze complex data sets and extract valuable insights.

Docusaurus Plushie

· One min read

Docusaurus Plushie

If a mirror is positioned on the surface of a sphere and is perpendicular to a line that extends from the center of the sphere to a point on the surface of the sphere, light from outside the sphere that is directed towards the mirror will be reflected off the mirror's surface and into the center of the sphere.

Docusaurus Plushie

Docusaurus Plushie

· 2 min read

Prepare prices data

In order to effectively analyze and visualize real estate data, it is important to first properly organize and process the data. To this end, our team combined three separate files containing price paid data into a single file and cleaned and filtered the data through a series of steps. These steps included the removal of quotes, the selection of only rows with "GL" followed by a number, the printing of certain columns, the addition of column names, and the deletion of rows with null values.

Once the data was cleaned and organized, we used the powerful tool ogr2ogr to convert a file with cadastral parcel information into a PostgreSQL file. We then changed the projection from OSGB to WGS84 and imported it into a database. In order to store the data in a structured manner, we started a psql session and created empty tables with certain columns in the database.

Next, we used the \copy command and SQL JOIN to combine the price and coordinates data based on their shared postcodes. We added a column for geometry data and used the latitude and longitude data to create points. We then calculated the average value for each of the duplicate polygons.

Finally, we used the powerful mapping software QGIS to export the table from the database and modified the layer properties for visual appeal. Through this process, we were able to effectively organize and analyze the real estate data, allowing us to extract valuable insights and gain a deeper understanding of the market.

Docusaurus Plushie

During our analysis of real estate data, we encountered an issue with some of the postal codes not being properly associated with the intended polygons. This issue had the potential to significantly impact the accuracy and usefulness of our data.

To address this issue and improve the accuracy of our data, we decided to use a different set of polygons (parishes) with a lower resolution for the next project. We hoped that this approach would help to more accurately associate the postal codes with the intended polygons, resulting in a more reliable dataset.

· 2 min read

As engineers and designers, we are often approached with unusual and challenging requests. One such request came from an artist who asked us to help find a suitable geometry for a large egg sculpture. Intrigued by the opportunity to collaborate with an artist and apply our skills in a creative context, we set out to identify possible geometries using generative algorithms in Grasshopper 3D.

The first step in our process was to understand the constraints and requirements of the project. The artist provided us with a set of parameters, including the desired size and shape of the sculpture, as well as the materials that would be used to construct it. With this information in hand, we began to explore different algorithmic approaches that could be used to generate a range of possible geometries.

We turned to Grasshopper 3D, a powerful tool for generative design that allows users to define and manipulate geometry through a series of algorithmic rules. Using a combination of mathematical functions and input from the artist, we were able to generate a range of potential geometries for the egg sculpture.

To narrow down our options and select the most suitable geometry, we used a variety of methods to evaluate and compare the different options. We considered factors such as structural integrity, ease of fabrication, and aesthetic appeal, and used computer simulations and physical prototypes to test the performance of the different geometries.

In the end, we were able to identify a geometry that met all of the requirements and constraints of the project. The artist was pleased with the result and used our geometry to create a stunning egg sculpture that was well-received by the public.

This project was a rewarding and exciting example of the ways in which engineering and design can intersect with the arts. By using generative algorithms and a collaborative approach, we were able to help an artist realize their vision and create a beautiful work of art.

Docusaurus Plushie

Docusaurus Plushie

· 3 min read

The Isle of Wight Festival 2019 was a large-scale event that took place at Seaclose Park on the Isle of Wight. With 3km of arenas and fields to cover, the deployment of the network was a massive and complex undertaking. To ensure that the site was properly connected, network cabinets were set up in each arena and connected with miles of fiber optic cable. These cabinets were then connected to multiple ADSL connections that were bonded together, providing a robust and reliable internet connection.

To provide connectivity within each arena, smaller network switches were located within 100m of the cabinets. Locations that were beyond this range were connected with wireless point-to-point links, which were either mounted on poles attached to the sides of tents or beam out across the arena from wireless sectors mounted on cherry pickers. These signals were then picked up at distant locations through wireless point-to-point receivers attached to the sides of tents.

In addition to the network infrastructure, the event also required a comprehensive CCTV system to ensure the safety of attendees. To this end, at least one cherry picker equipped with a pan-tilt-zoom CCTV camera was stationed within each arena, with additional cameras installed on scaffolding poles, gateway arches, and stage sides. WiFi was also provided in the crew and camping areas, and temporary offices were equipped with temporary WiFi and VoIP phones for both internal and external communication.

To aid in the deployment and management of the network, we utilized a number of tools and resources. For example, we used QGIS's 'Align Raster' tool to georeference a high-definition image of the site map, which we then uploaded to Mapbox and used to create a basic Leaflet.js web map. This map used the host phone's geolocation to position a marker, helping us to determine our exact location on the site and identify which tents required connectivity. We also used the 'Map Marker' app on Android to quickly locate network devices as we deployed them.

After the event, the map was used to quickly locate and retrieve all of the equipment. This was particularly useful as the staff members who investigate faults or retrieve hardware after an event are often different from those who deployed it, making it difficult to locate the devices without a detailed and up-to-date map showing their locations and connections. By using this map, we were able to efficiently trace faults in the network and ensure that all of the equipment was properly accounted for. Overall, the deployment and management of the network at the Isle of Wight Festival was a successful and complex endeavor that helped to ensure the smooth operation of the event.

· 2 min read

The web application we developed allows users to access and update the location data for network devices. When the location of a device needs to be recorded, the user simply enters the device's MAC address into the app. The MAC address is then checked against a list of available device MAC addresses in the database to verify its authenticity. If the MAC address exists in the database, it is marked as "deployed" and the coordinates of the user's phone, on which the update was made, are added to the latitude and longitude columns. If the MAC address is entered incorrectly or does not correspond to a device in the database, the app user is notified and asked to enter a different MAC address.

The deployed devices are displayed on a map in real-time, allowing users to easily view and locate them. Each device can be clicked on to view information such as its device type, MAC address, IP address, and more. Users also have the option to select a device for deletion, which changes the corresponding value in the "deployment status" column to "false" and removes the latitude and longitude position values from the database.

To aid in testing and debugging the app, we also developed a BASH script that produces fake data for testing purposes. This script generates a CSV file containing random MAC addresses, asset tags, device models, and locations, which can then be uploaded to the database for testing purposes. By using this script, we were able to simulate different scenarios and ensure that the app was functioning correctly before deploying it in a live environment.

#!/bin/bash

# Generate 100 random devices
for i in {1..100}
do
# Generate a random MAC address
mac=$(c=0; until [ $c -eq "6" ]; do printf ":%02X" $(( $RANDOM % 256 )); let c=c+1; done | sed s/://)

# Generate a random asset number
asset=$(( $RANDOM % 9999 + 1000 ))

# Choose a random location from the locations.txt file
location=$(shuf -n 1 locations.txt)

# Choose a random model from the models.txt file
model=$(shuf -n 1 models.txt)

# Output the device information to a CSV file
echo "$asset, $mac, $model, $location"
done > devices.csv

· One min read

Rewilding involves the restoration of natural habitats in areas that have been modified or degraded by human activity. One way to identify suitable areas for rewilding is to search for topographic areas that are characterized by natural environments. This can be achieved through the use of a SQL query to search for rows in a database table where the value "Natural Environment" appears in the "descriptivegroup" column. This column likely contains an array of descriptive tags or categories for each topographic area.

The results of this query can inform planning and conservation efforts by identifying areas that are potentially well-suited for rewilding. These areas could provide corridors for wildlife movement through urban environments and enhance biodiversity in these areas. By prioritizing these areas for restoration and rewilding, it is possible to improve the connectivity of natural habitats in urban areas and promote the health and well-being of these ecosystems.

SELECT *
FROM topographicarea
WHERE 'Natural Environment' = ANY (descriptivegroup)

Docusaurus Plushie

Docusaurus Plushie

You can see how the edges or roads and railway tracs could be used as wildlife corridors.

Docusaurus Plushie